Custom Reporting - Example Reports
 Updated 6 months ago
With POSaBIT's custom reporting tool, the options are endless with what data can be queried! There are 3 types of custom reporting offered within the Brand Portal - Sales, Discounts, and Inventory.
Sales: With the Custom Sales Report, analyze item-level sales data across multiple retailers with full flexibility. Dynamically add or remove columns such as product, product family, brand, retailer name, customer profile, and more — enabling deep, tailored insights into the performance of your product sales by retailer.
Discounts: The Custom Discount Report gives brands visibility into how discounts are being applied across retailers. Use this report to track the performance of promotions, understand which discounts drive the most sales, and compare discount strategies across different products or stores. This insight helps you evaluate ROI on promotions, fine-tune pricing, and identify opportunities to strengthen discounting strategies.
Inventory: The Custom Inventory Report helps brands monitor product availability and stock levels across retailers. Use this report to track where inventory is running low, identify aging products, and ensure consistent supply to meet customer demand.
Example Custom Reports
Sales
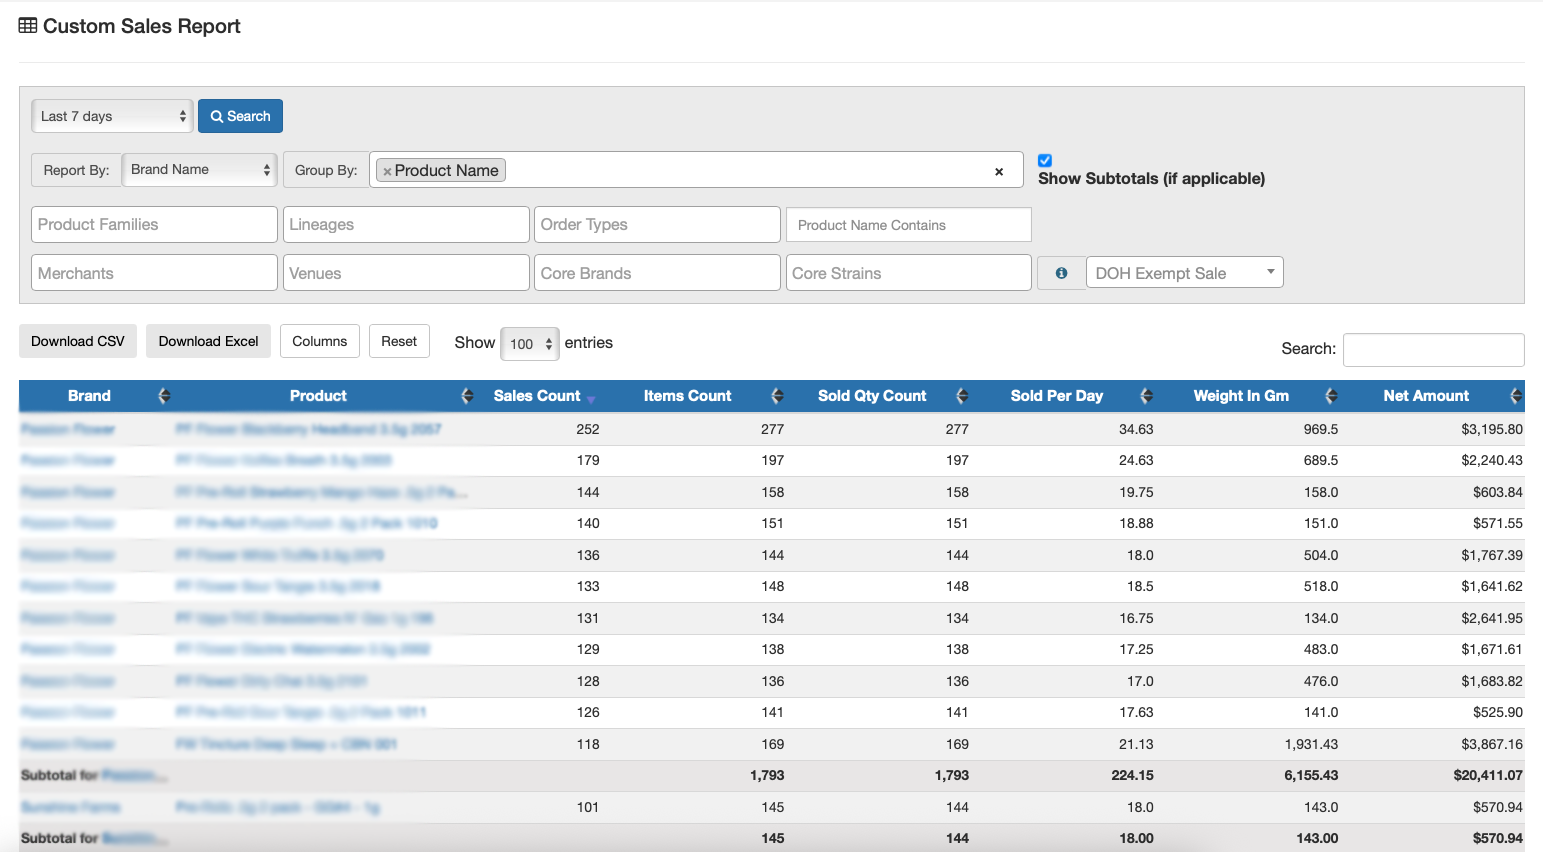
Brand Name by Product Name
- Select date range, report by = brand name, and group by = product name
- This is a basic item level report that provides a high-level overview of sales for each product across your brand(s).
- Click on 'Columns' to show/hide the data you'd like this report to display.
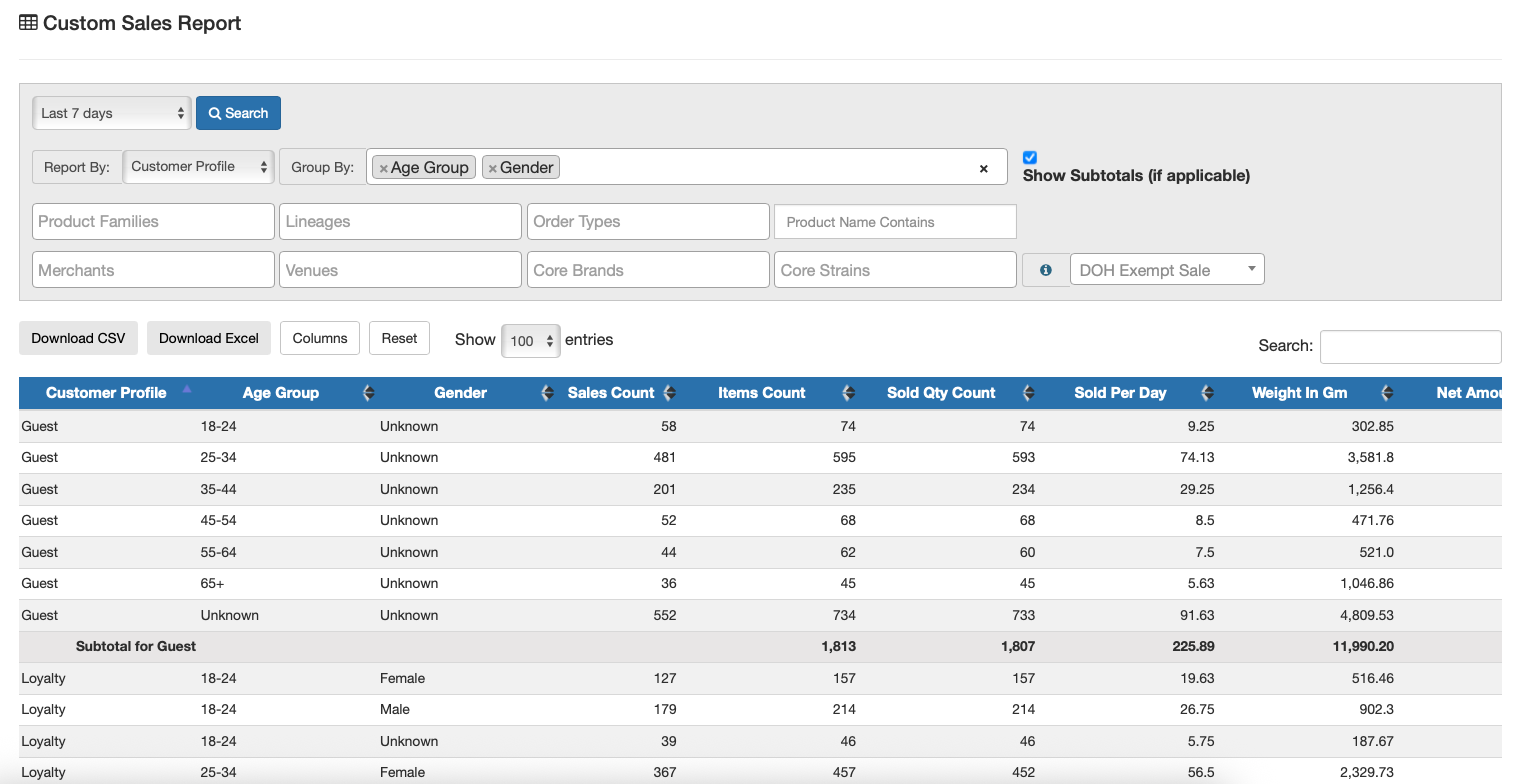
Customer Profile by Age Group and Gender
- Select date range, report by = customer profile, and group by = age group, gender
- This report provides insight into who is buying your products, broken down by age group and gender, and segmented by guest/non-members versus loyalty customers. Use it to better understand your audience, tailor marketing campaigns, and align product strategies with customer demographics.
- Click on 'Columns' to show/hide the data you'd like this report to display.
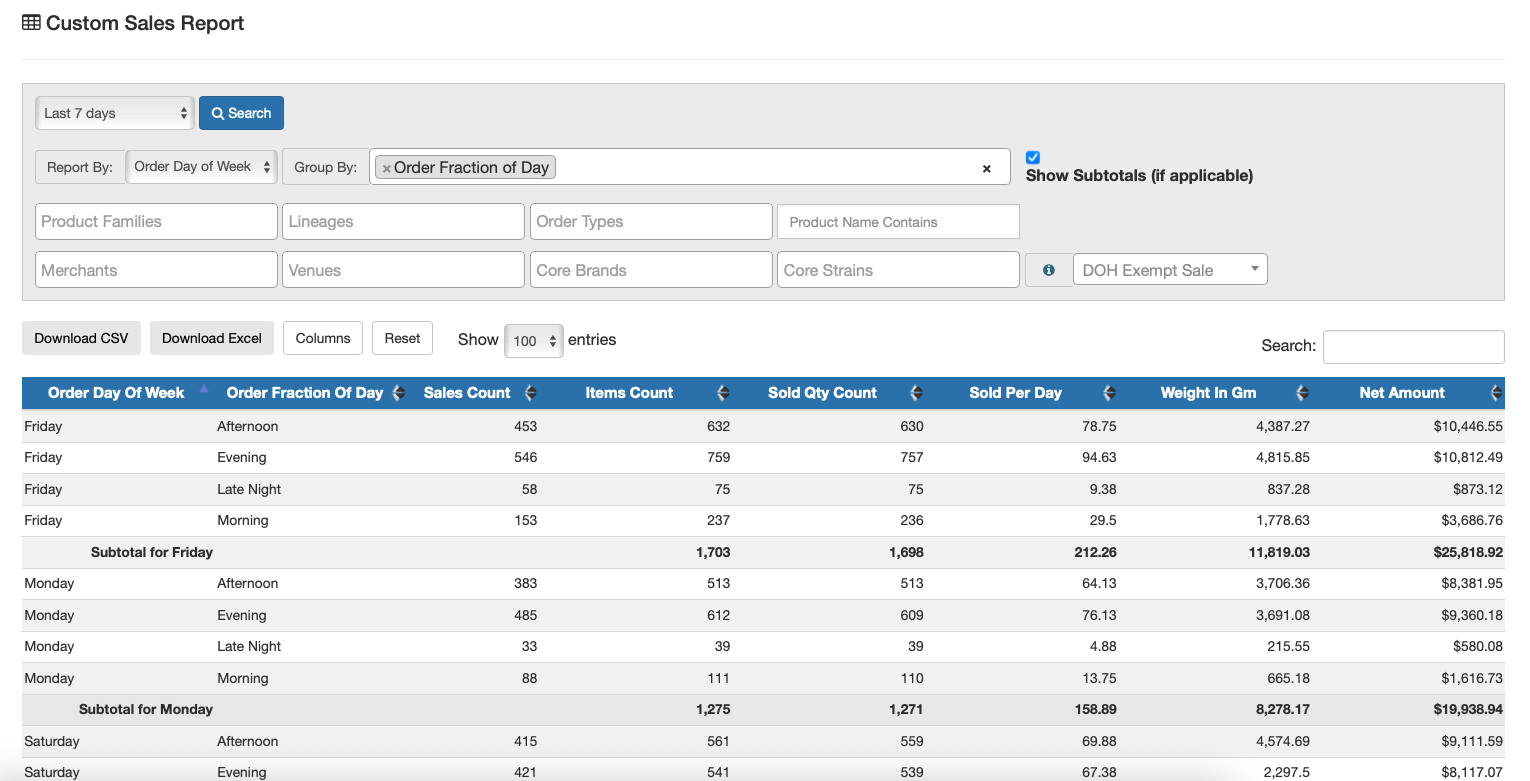
Order Day of Week by Order Fraction of Day
- Select date range, report by = order day of week, and group by = order fraction of day
- This report highlights when customers are placing orders, breaking down day of the week and time of day (morning, afternoon, evening, late night). Brands can use this insight to identify peak sales times, optimize inventory planning, and schedule marketing campaigns or promotions to align with times of highest demand.
- Click on 'Columns' to show/hide the data you'd like this report to display.
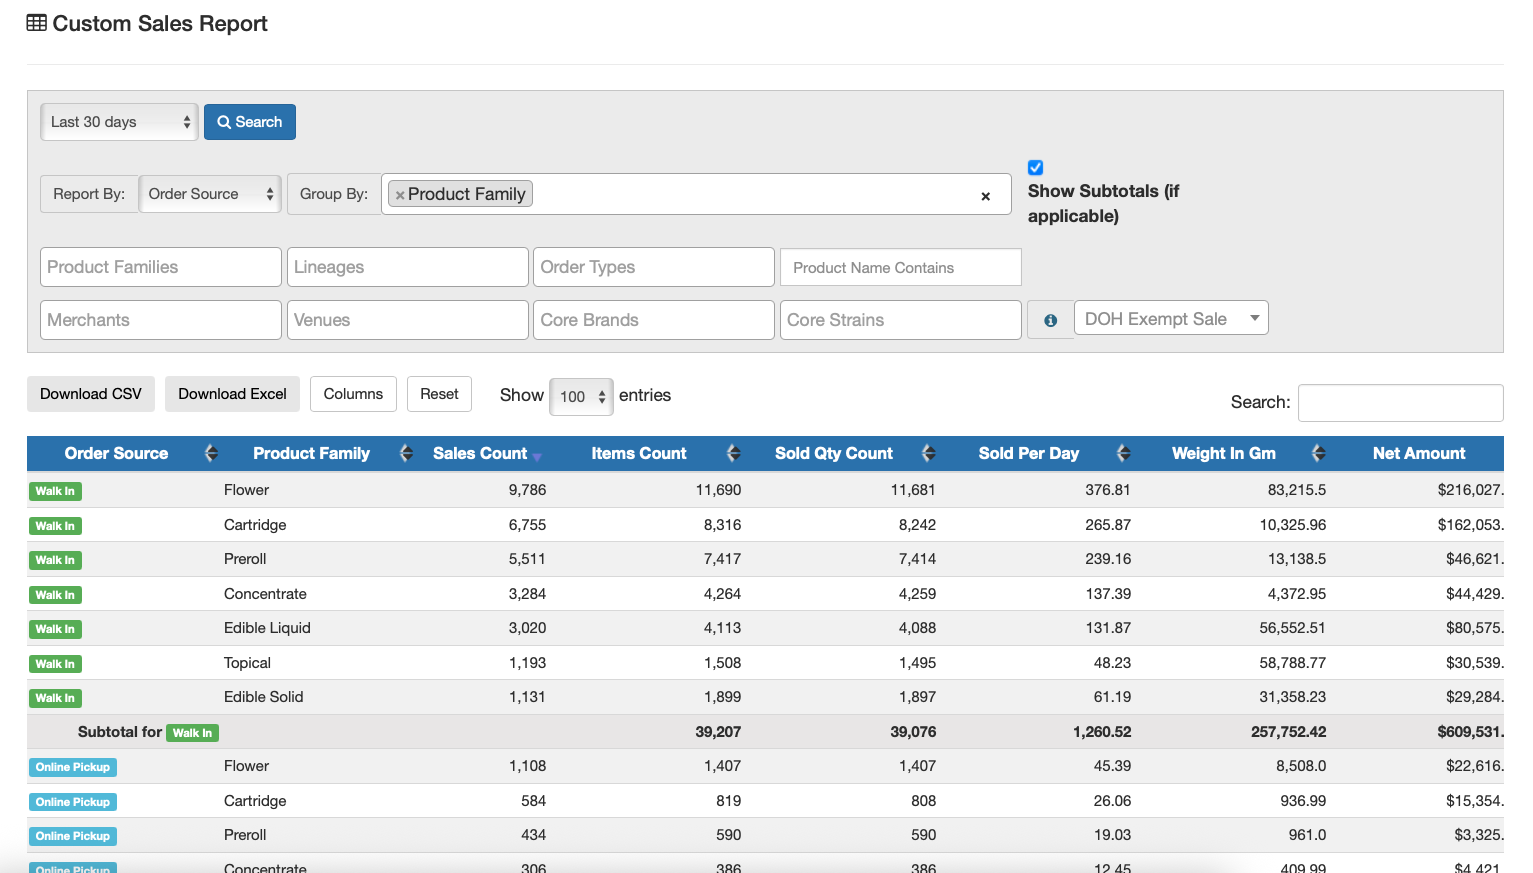
Order Source by Product Family
- Select date range, report by = order source, and group by = product family
- This report shows the break down of sales by product family for in-store (walk-in) and online pickup orders. These insights can be used to better understand shopping preferences, measure the impact of online ordering, and adjust product strategies or promotions to better support each sales channel.
- Click on 'Columns' to show/hide the data you'd like this report to display.
Discounts
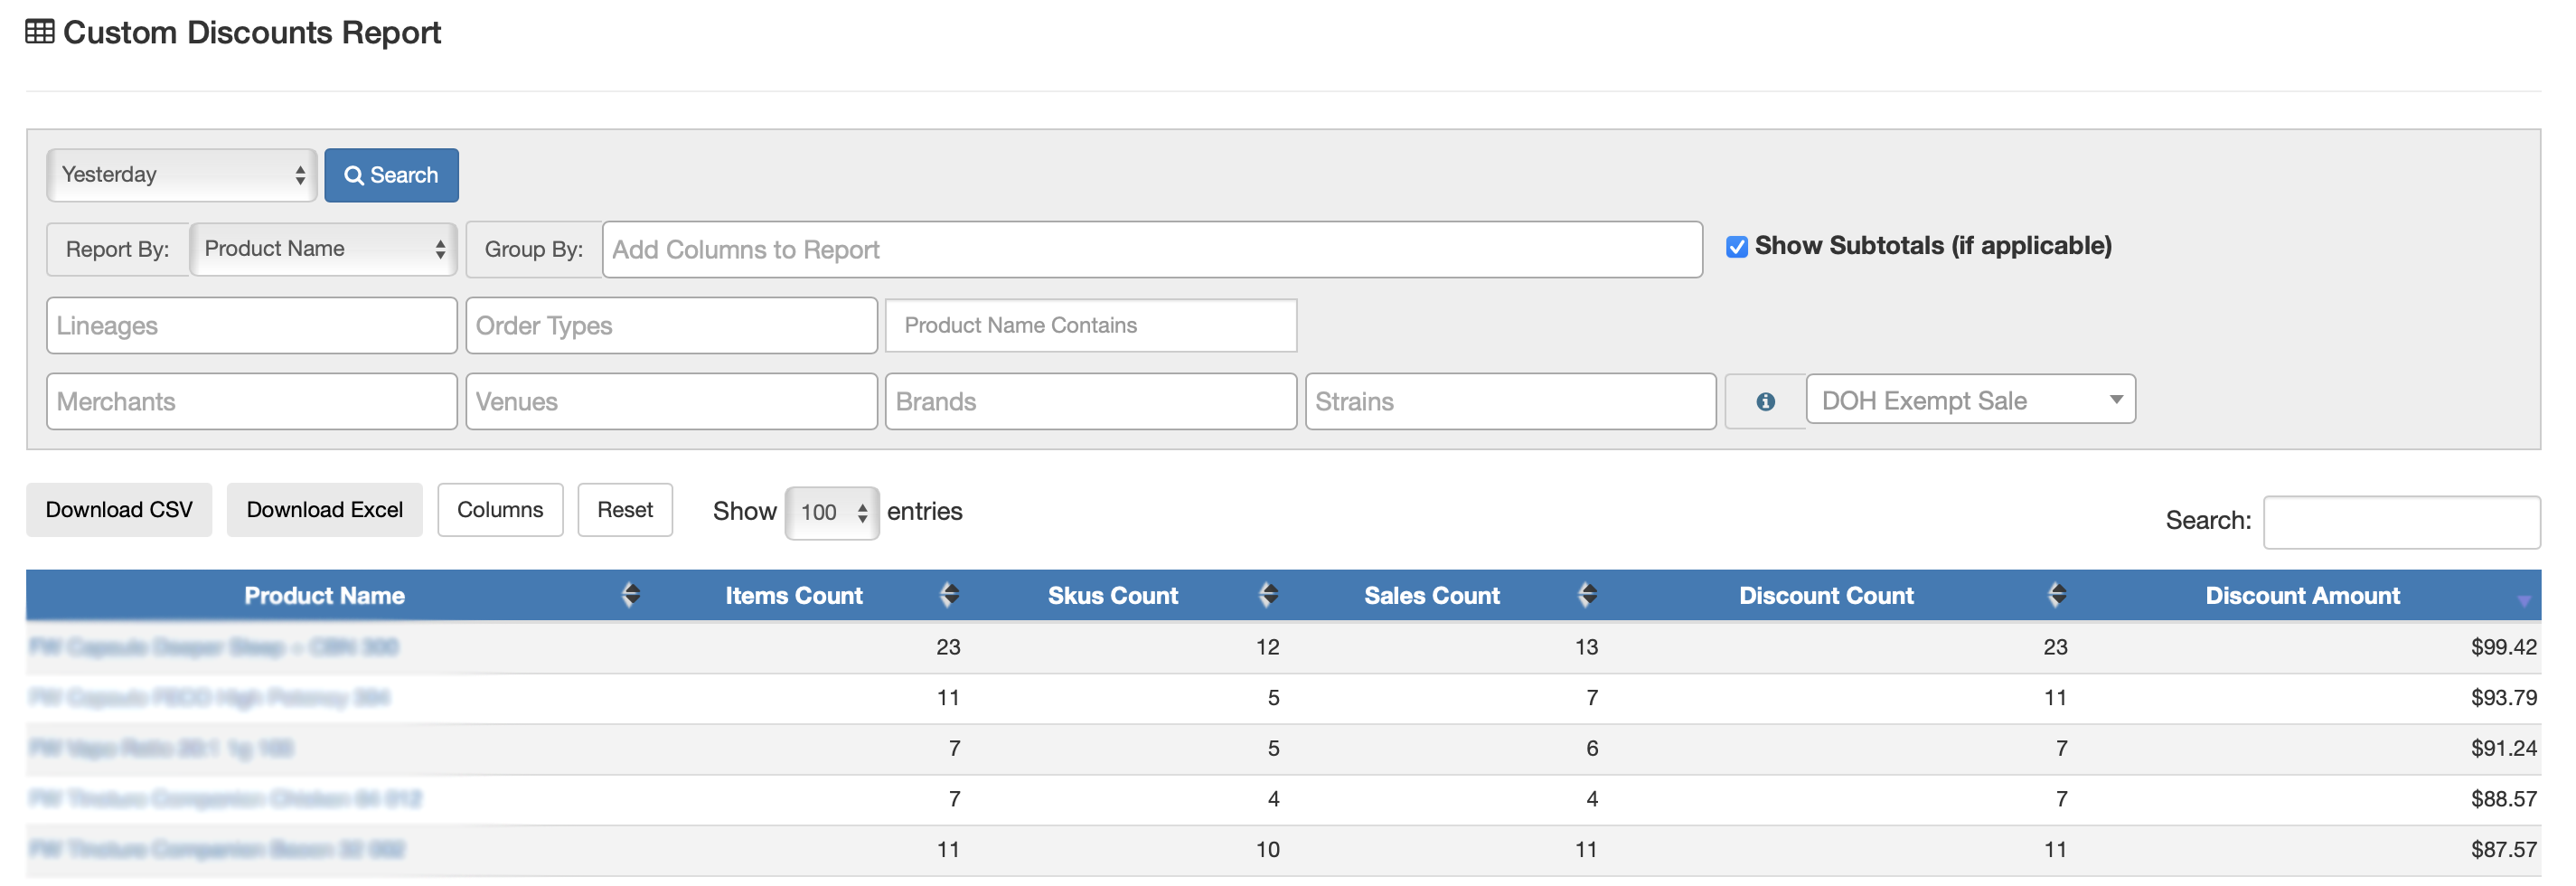
Discounts by Product Name
- Select date range, report by = product name
- This report uses retailer data to show how discounts are applied at the individual product level. Brands can use it to evaluate the effectiveness of discounts on specific products, understand which items respond best to promotions, and refine pricing or marketing strategies to improve sales performance.
- Click on 'Columns' to show/hide the data you'd like this report to display.
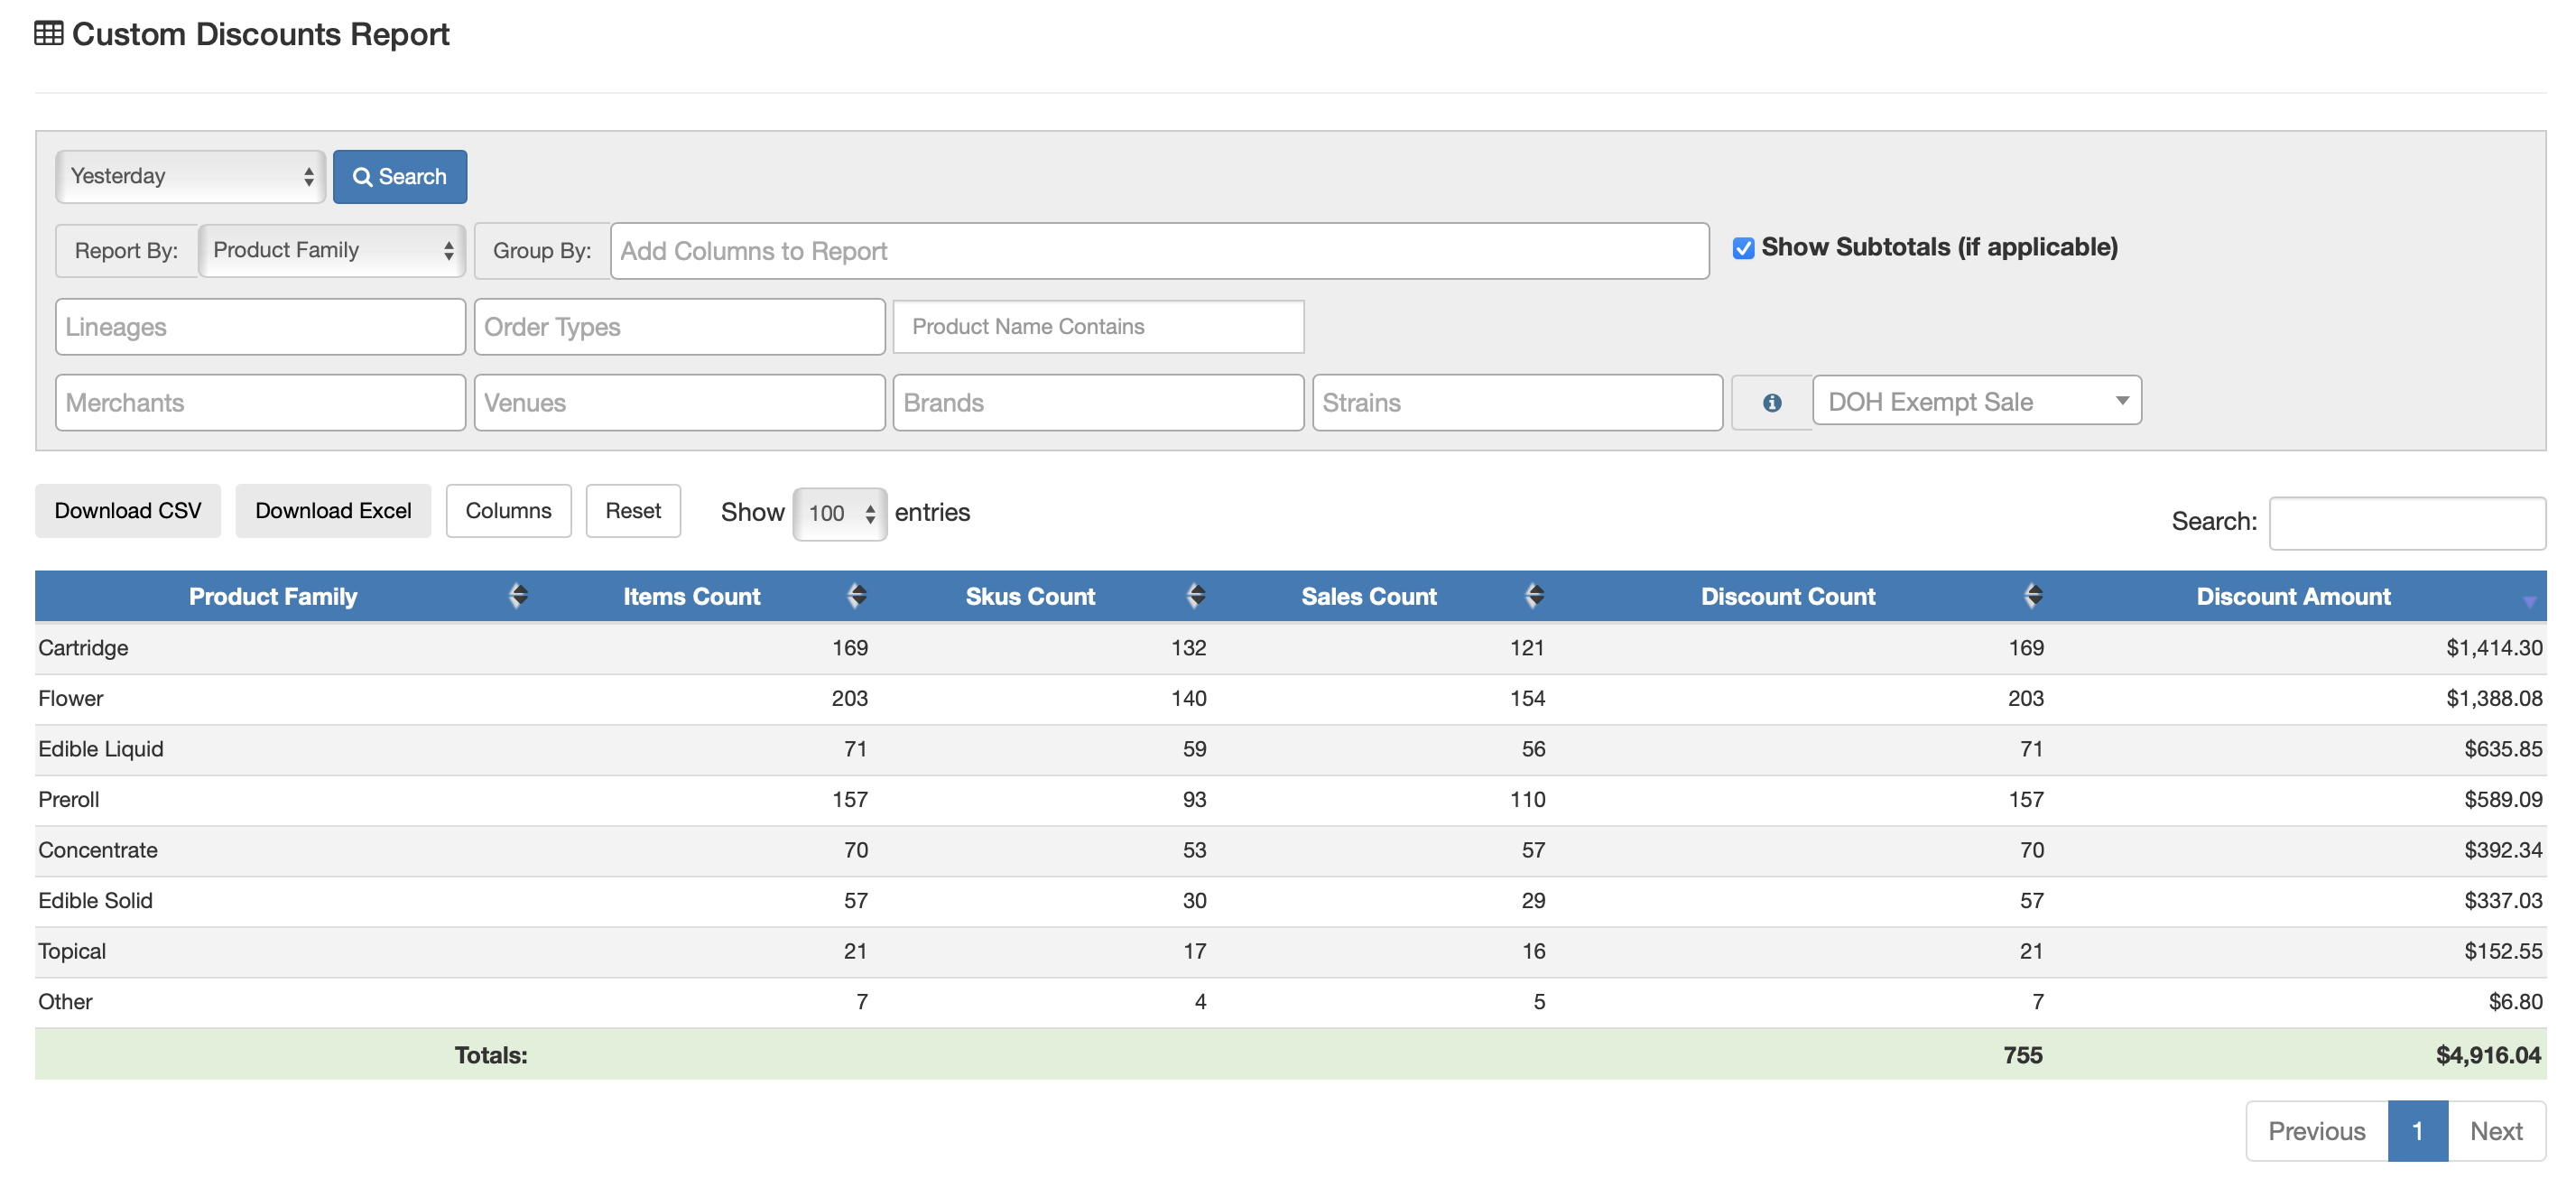
Discounts by Product Family
- Select date range, report by = product family
- This report uses retailer data to show how discounts are applied across product families (e.g., flower, prerolls, concentrates). Brands can use it to see which categories benefit most from discounting, compare promotional effectiveness across product types, and adjust strategies to better align discounts with consumer demand.
- Click on 'Columns' to show/hide the data you'd like this report to display.
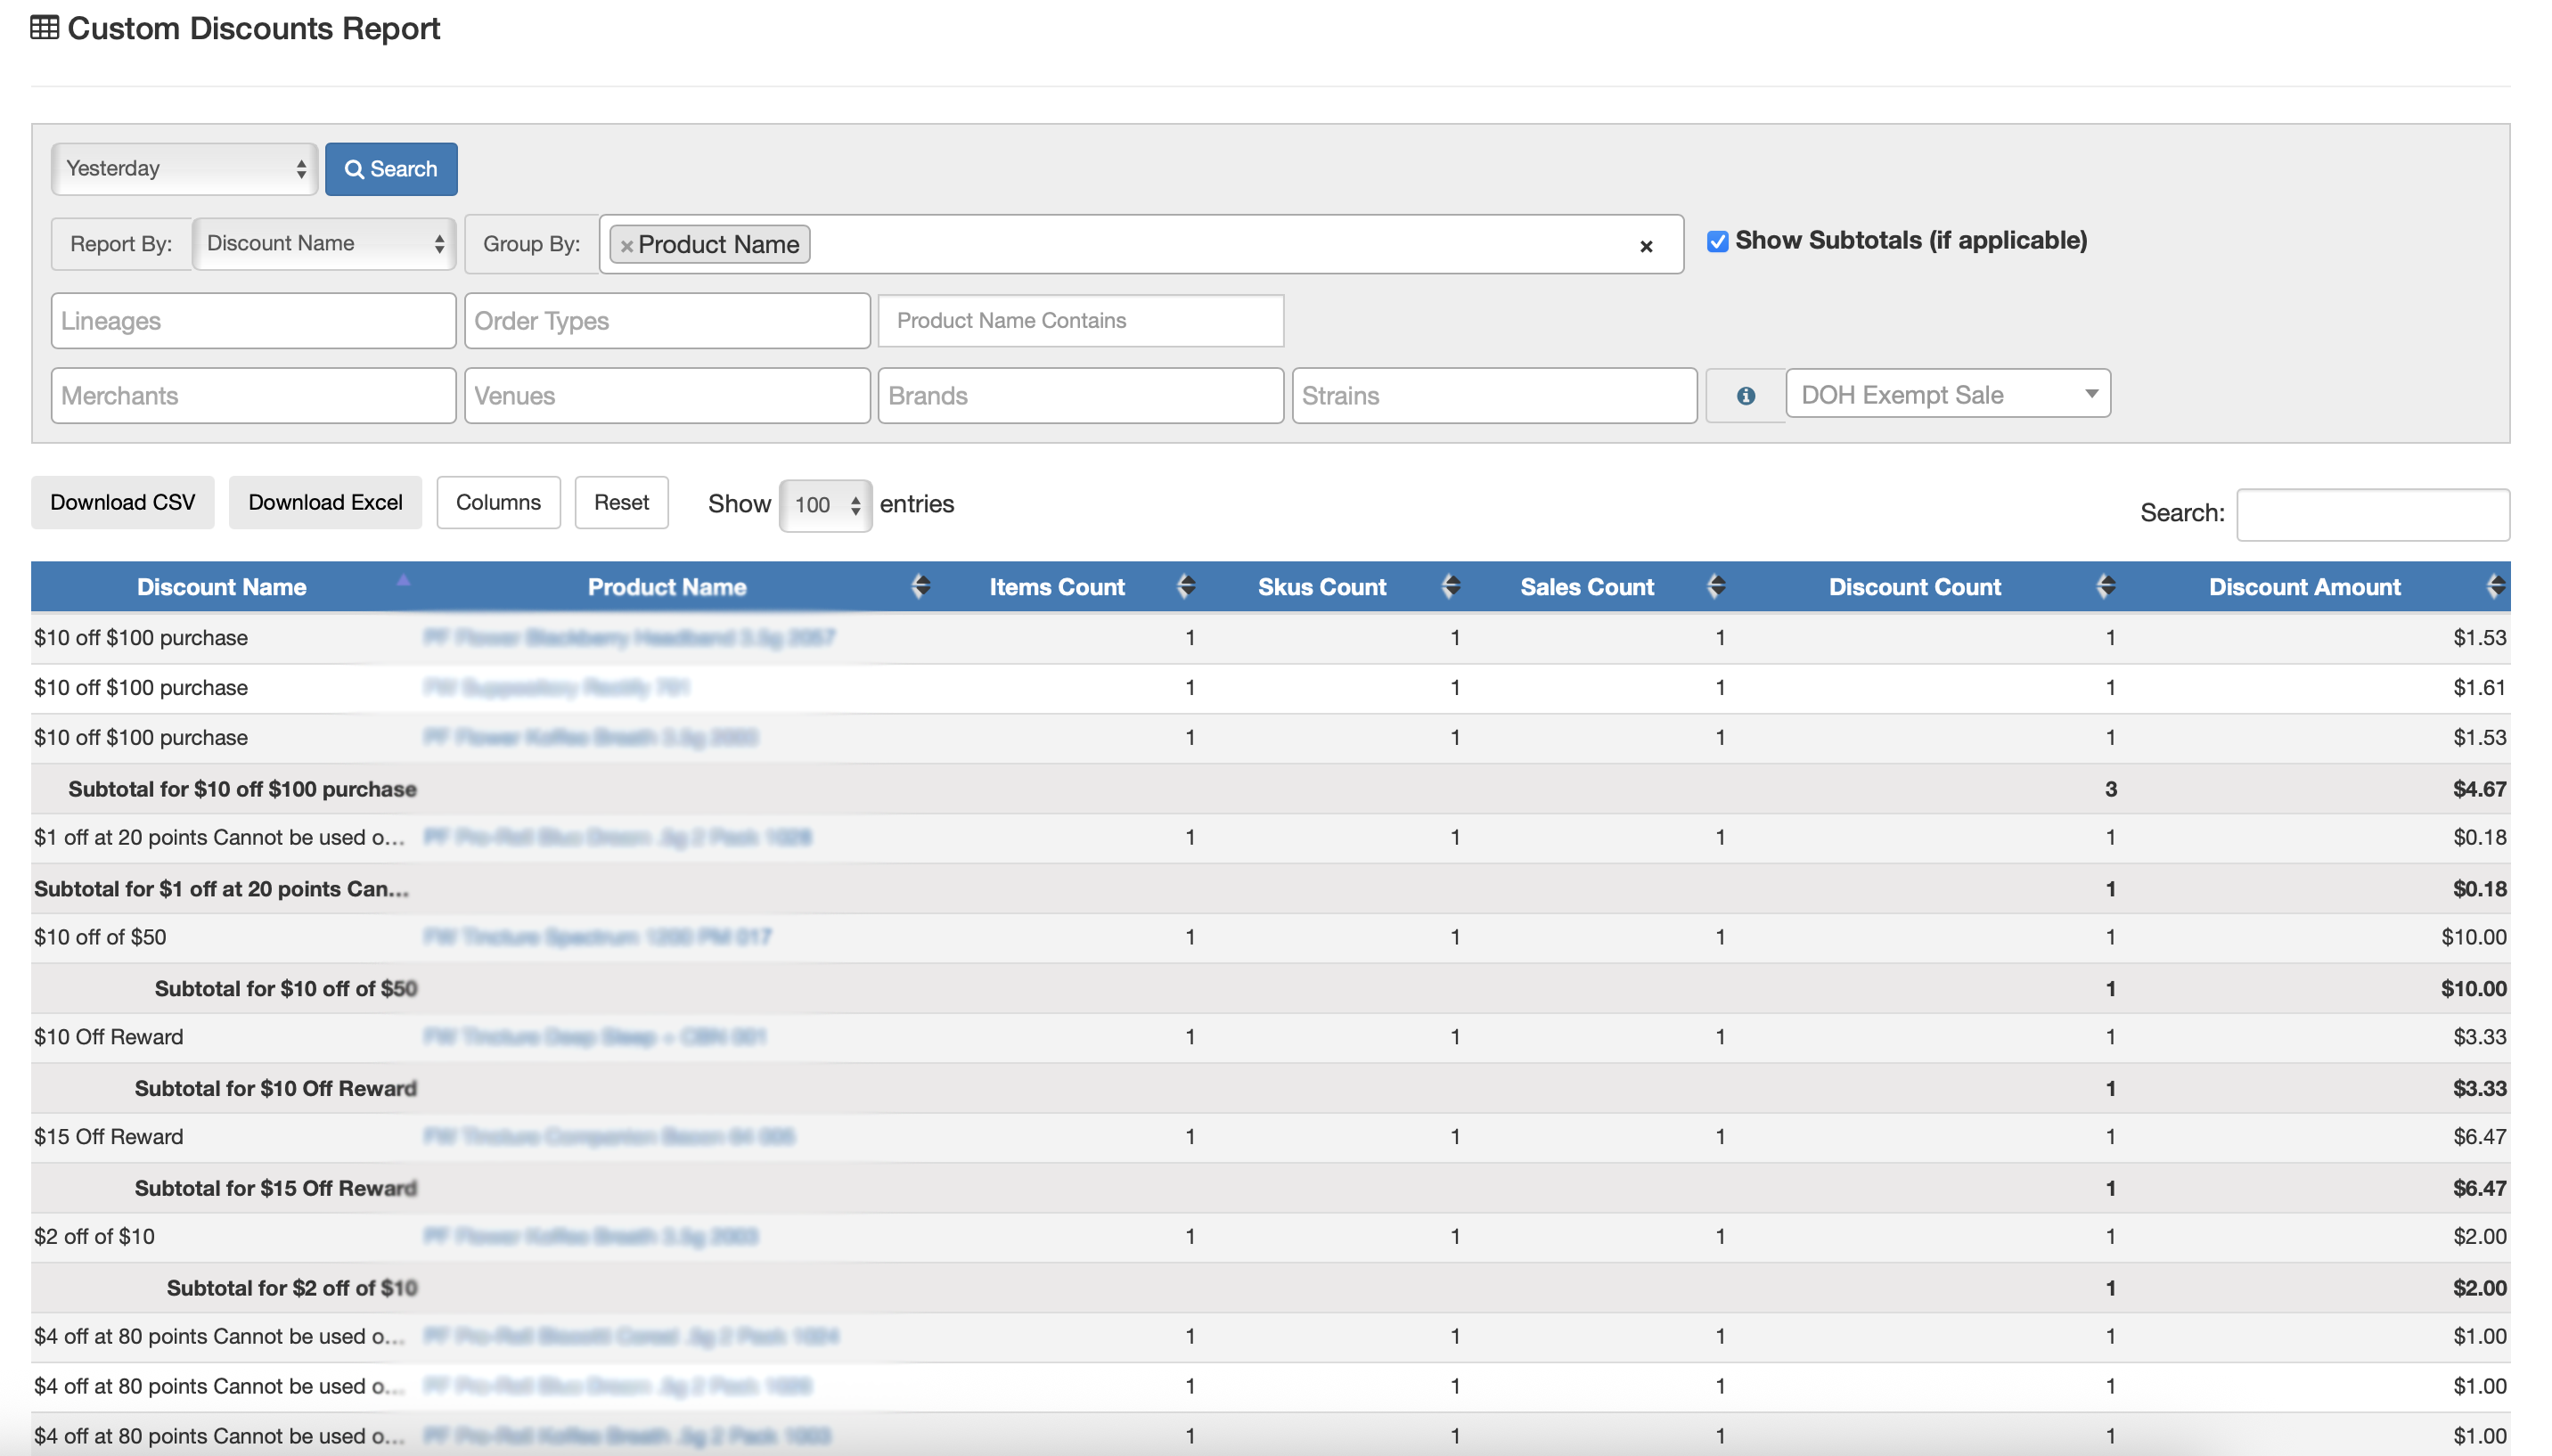
Discount Name by Product Name
- Select date range, report by = discount name, and group by = product name
- This report shows which discounts are being applied to specific products. Brands can use it to measure the effectiveness of promotions at the product level, identify which discounts drive sales, and refine pricing or promotional strategies to maximize ROI.
- Click on 'Columns' to show/hide the data you'd like this report to display.
Inventory
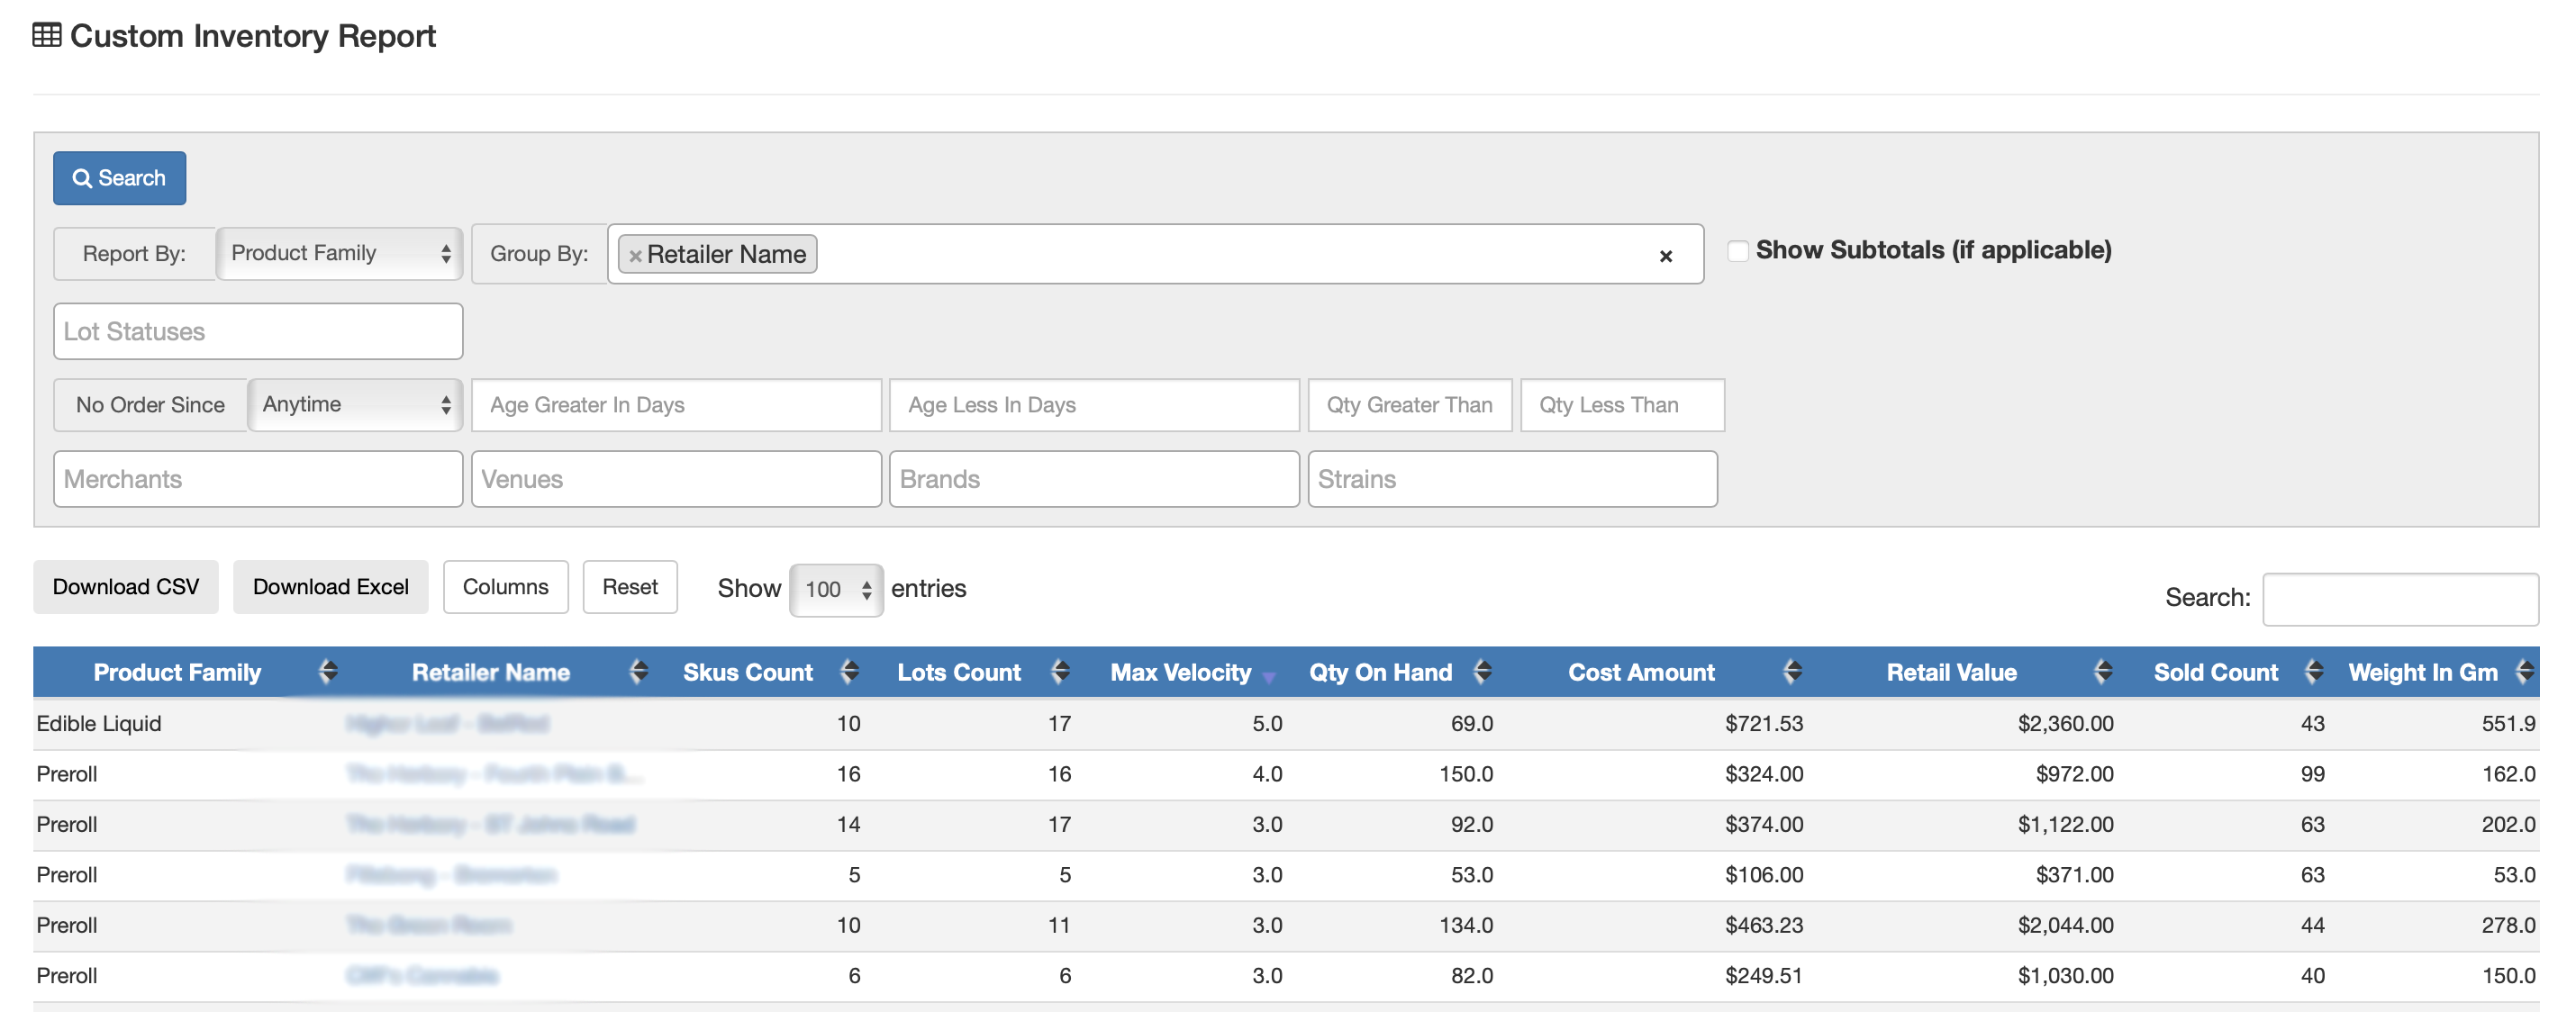
Inventory by Product Family and Retail Name
- Select date range, report by = product family, group by = retail name
- This report shows inventory levels by product family (e.g., flower, prerolls, concentrates) at each retailer location. Brands can use it to compare category performance across stores, identify which retailers need restocks, and adjust distribution strategies to meet demand.
- Click on 'Columns' to show/hide the data you'd like this report to display.
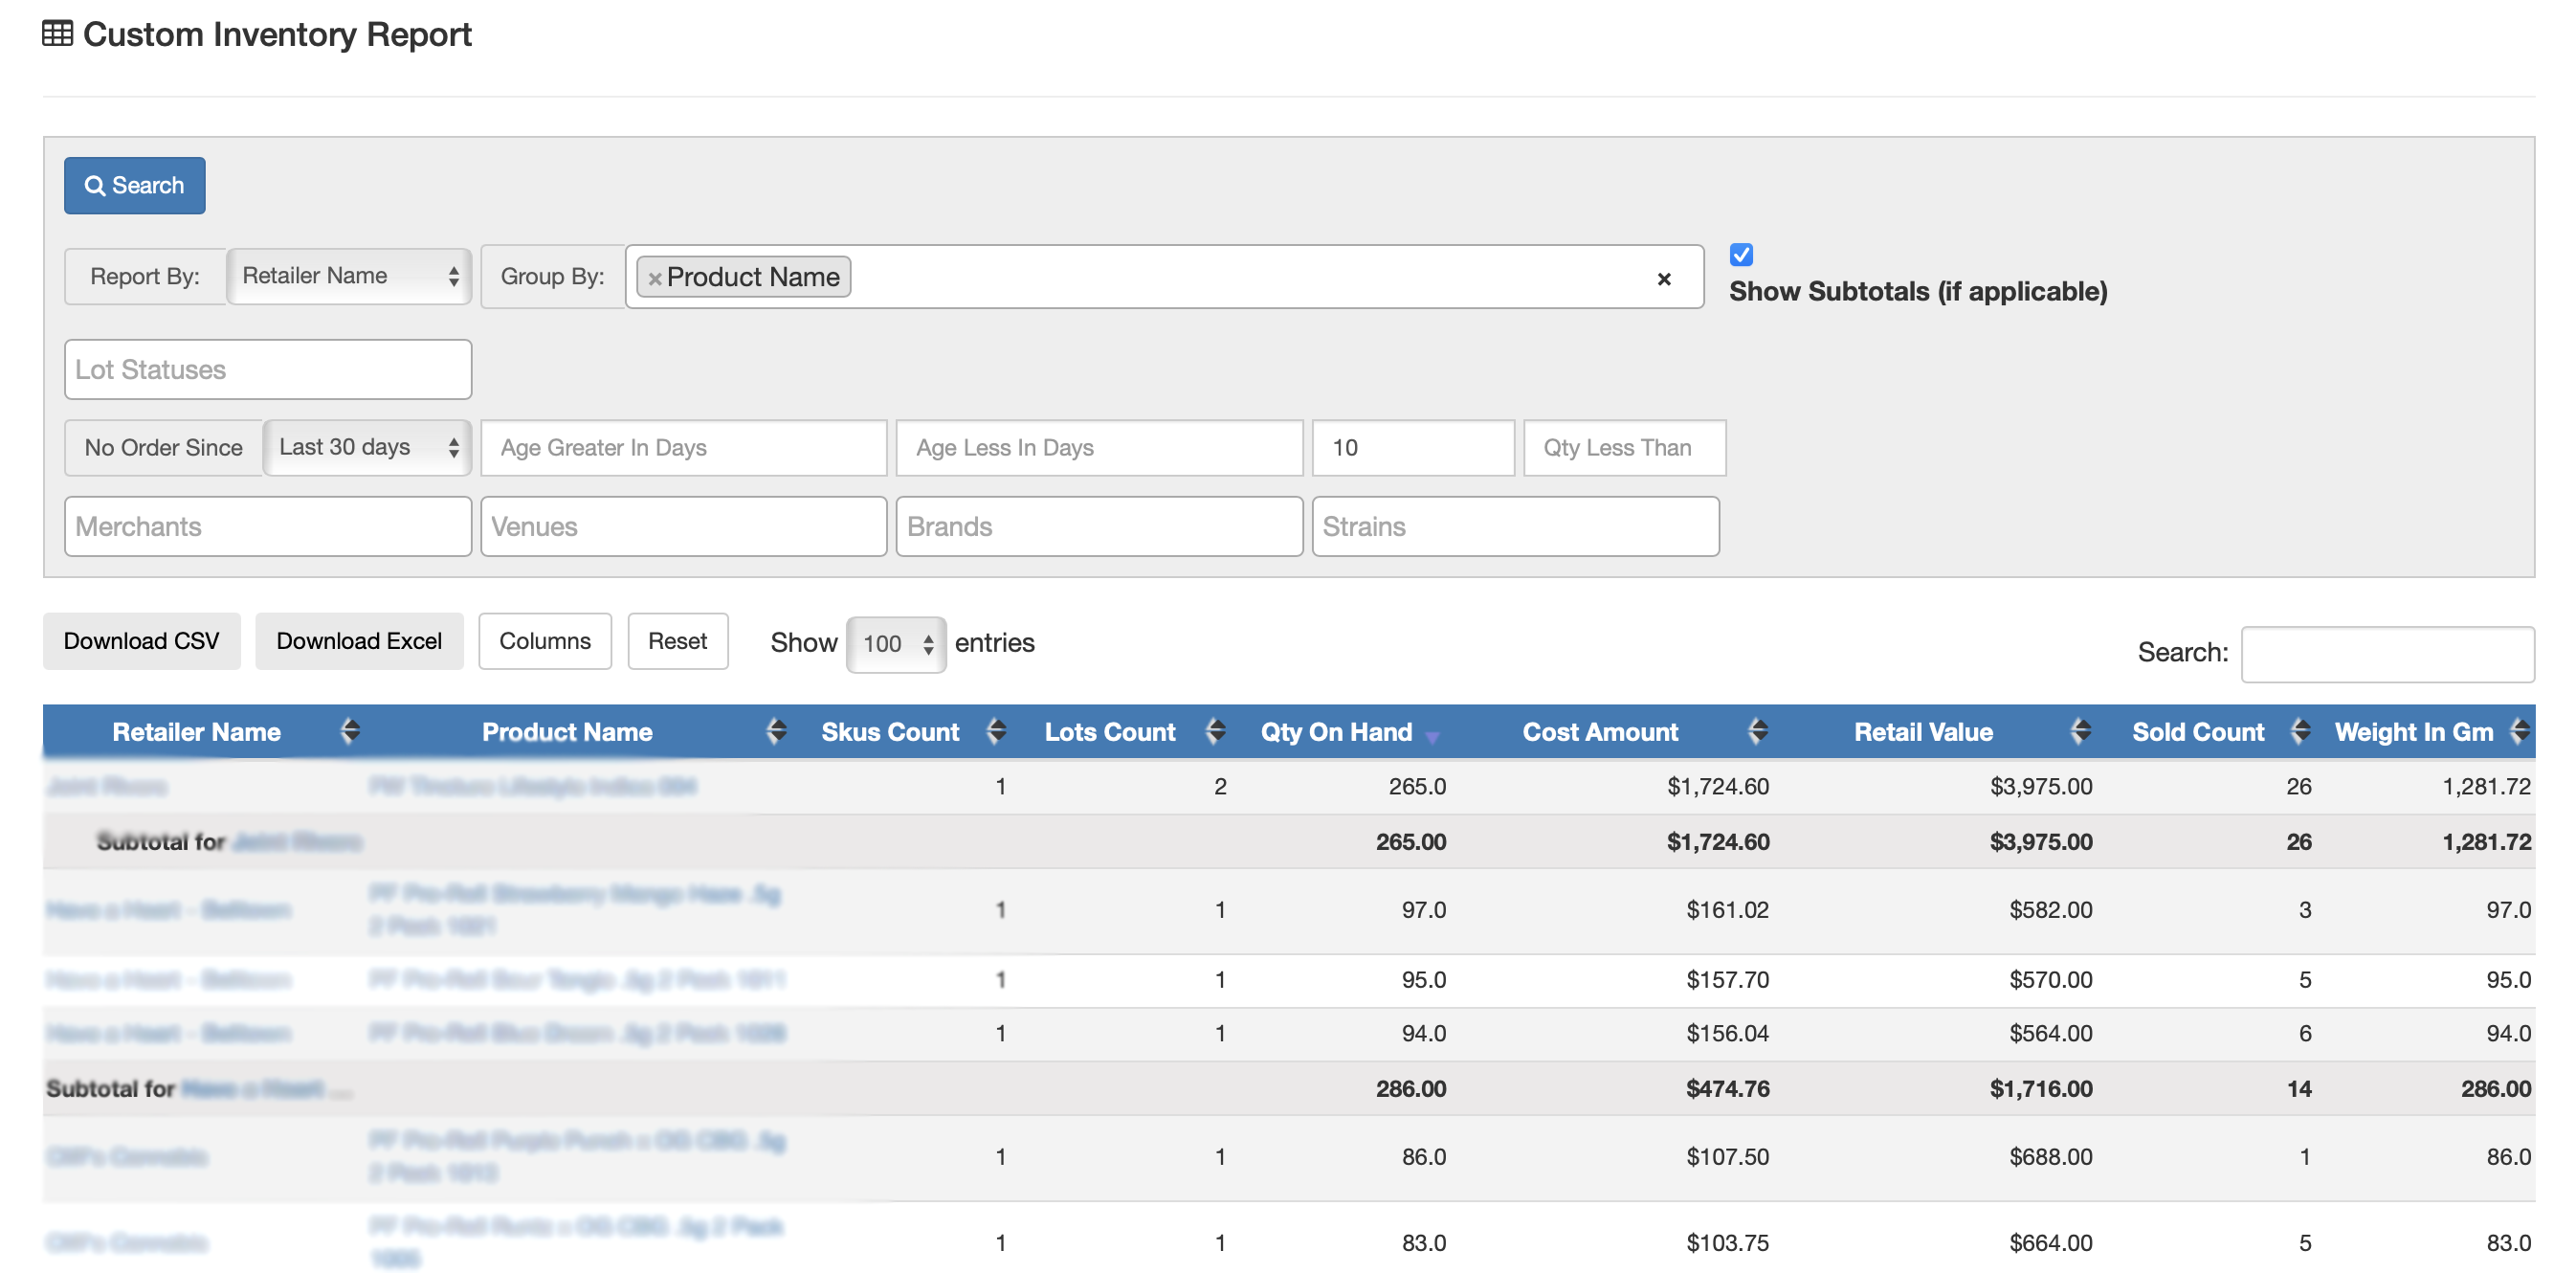
Inventory by Retail Name and Product
- Select date range, report by = retail name, group by = product name, no order since = last 30 days, qty more than = 10
- This report uses retailer data to show inventory by retail store and product name where no sales have occurred within a certain number of days (30 days in example) and with a minimum quantity (10 items in example) in stock. Brands can use it to spot stagnant products, identify where demand has slowed, and take action through promotions, or retailer engagement to reduce excess inventory.
- Click on 'Columns' to show/hide the data you'd like this report to display.
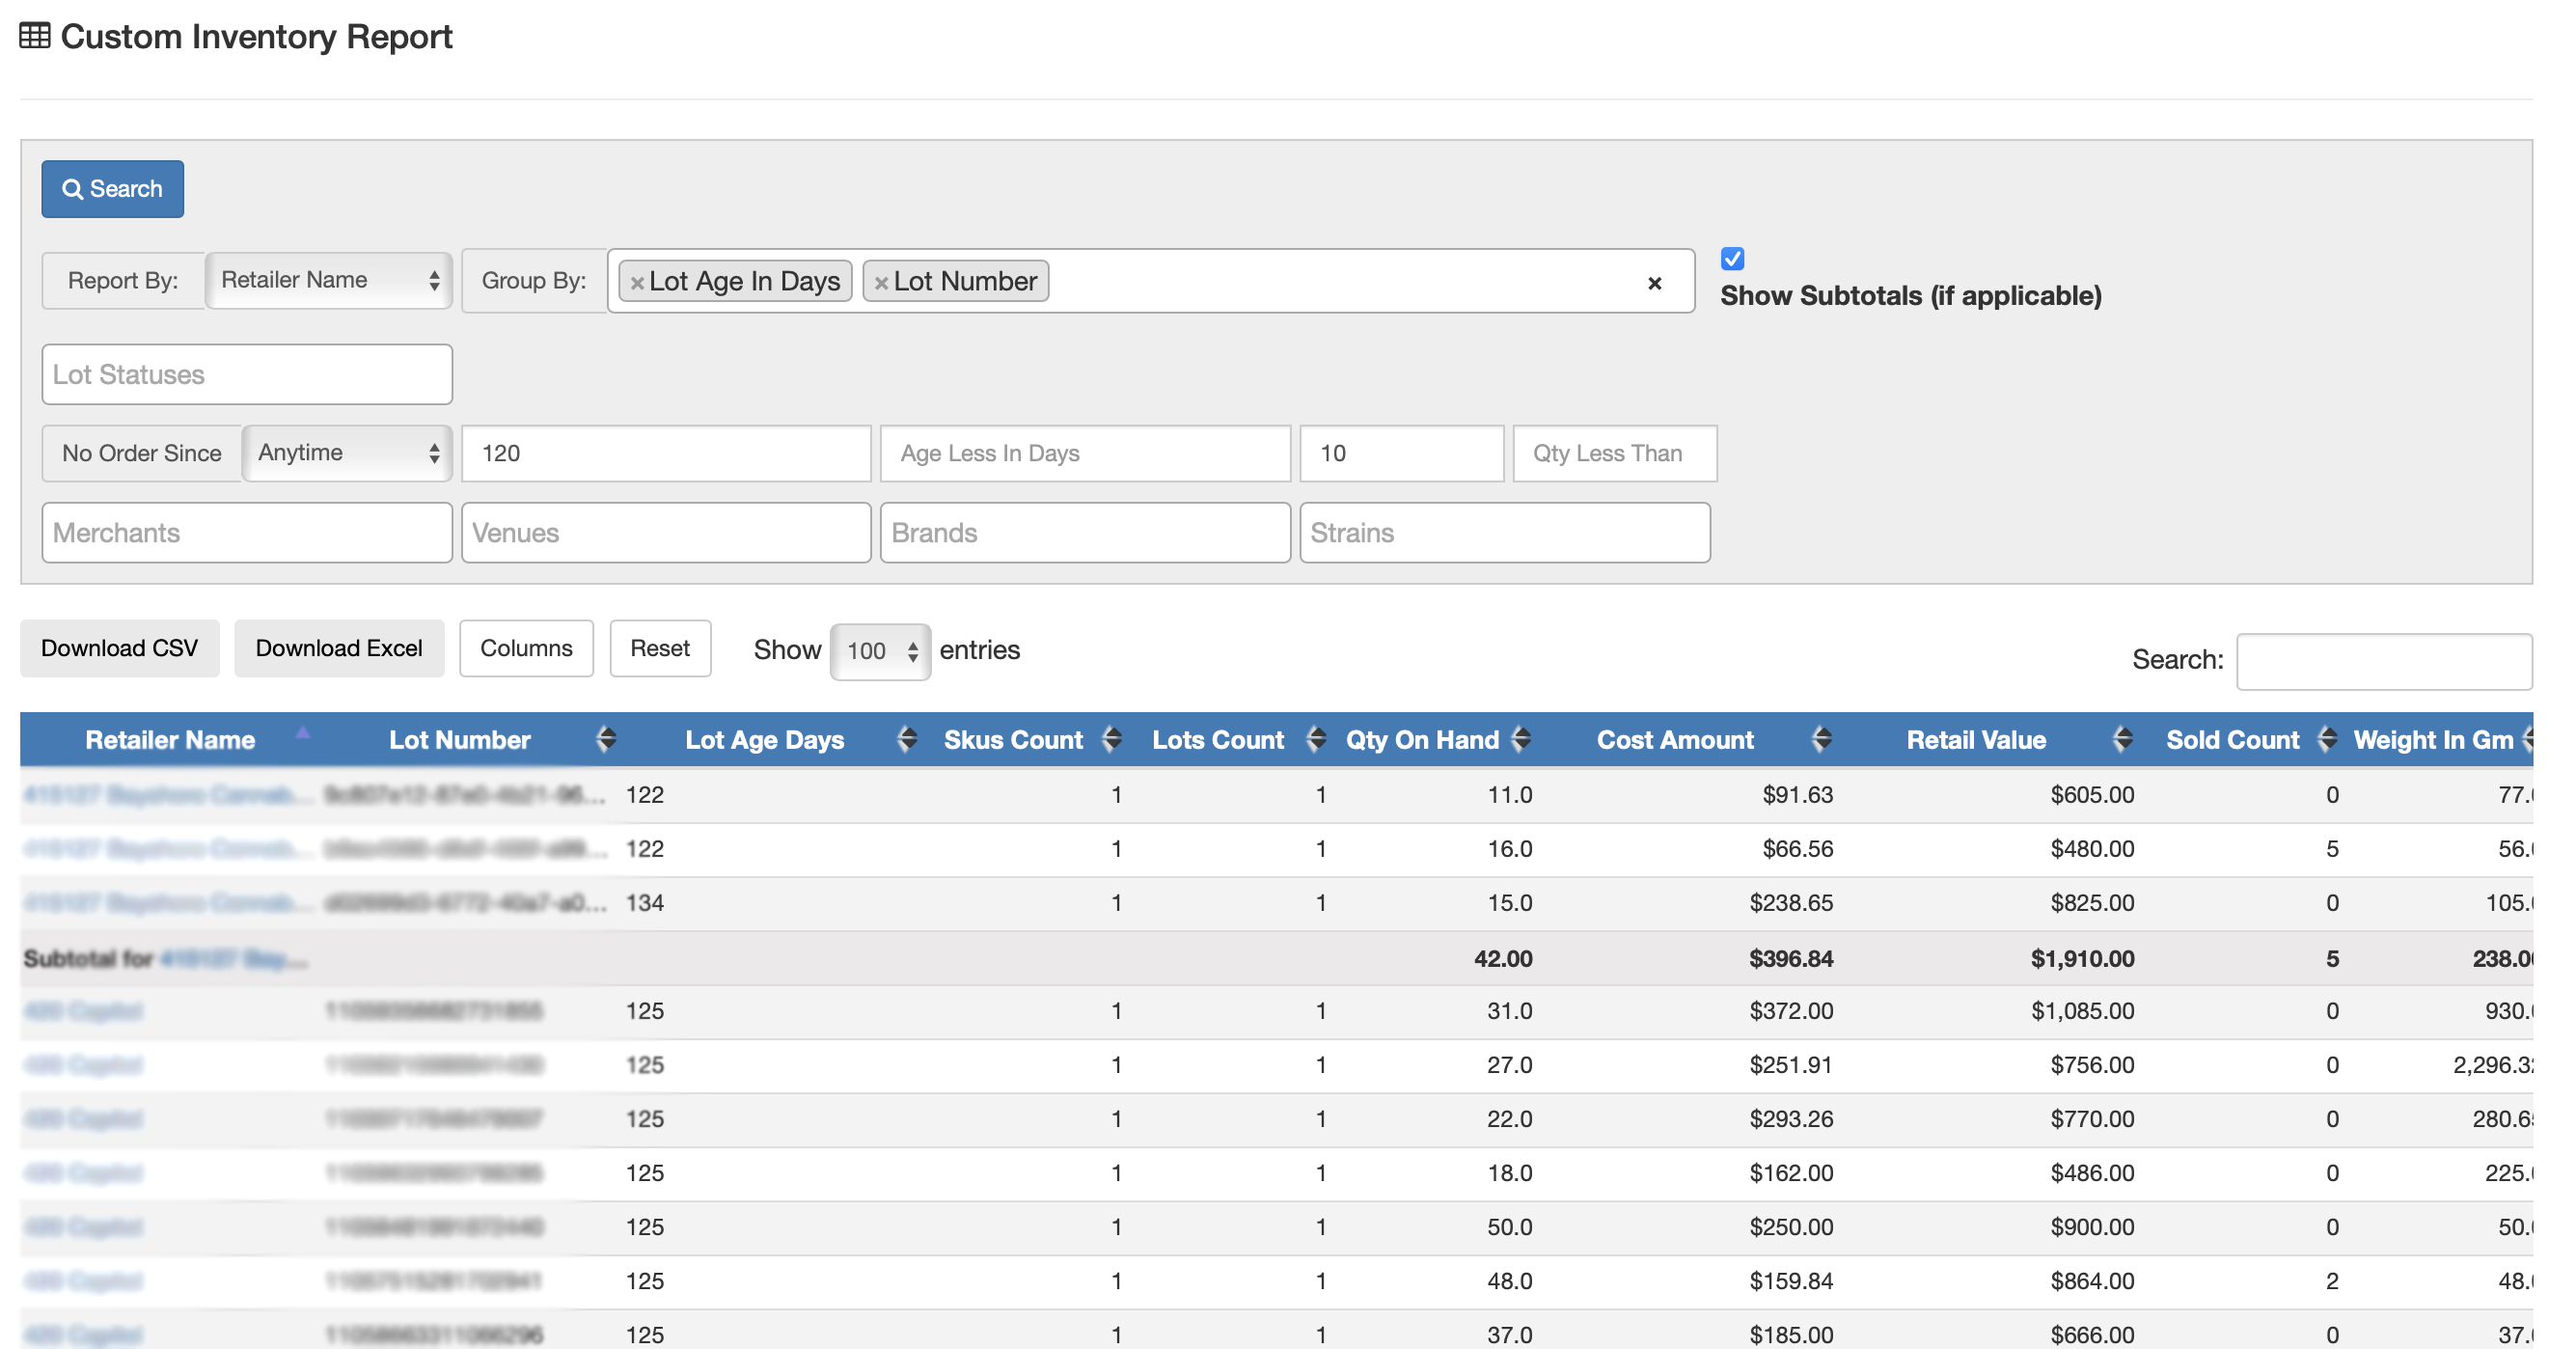
Inventory by Retailer Name and Lot Age in Days by Lot Number
- Select date range, report by = product family, group by = retail name, age greater in days = 120, Qty More Than = 10
- This report shows inventory by retail store, lot number, and lot age in days. It highlights lots that are at a certain number of days old (120 in example) with a minimum quantity of items (10 in example) in stock. Brands can use it to identify slow-moving products, plan promotional strategies to clear aged inventory, and prevent excess stock from going unsold or returned.
- Click on 'Columns' to show/hide the data you'd like this report to display.