Merchant Sales by Day Report

The merchant sales by day report provides a detailed display of sales across all venues. This report tracks various sales metrics over time to help you better identify long-term trends.
At the top of the screen, you will find an interactive line graph to help spot peak days vs. slower-moving days. Using the drop-down filter at the top of the screen, you can specify exactly which data you want to display on the graph. Additionally, using interactive color-coded lines for each venue, you can easily toggle on/off certain venues to compare all or just specific locations.
Data options for the graph include: sales count, sales amount, discount count, discount amount, refund count, refund amount, net sales, gratuity, tax, total, debit count, debit amount, cost, new customers, returning customers, guests, avg total, and profit
Along with this interactive graph, you will also find a table located at the bottom of the screen. This table breaks down each venue by individual day. This table can be easily sorted by clicking on the column titles found at the top of the table.
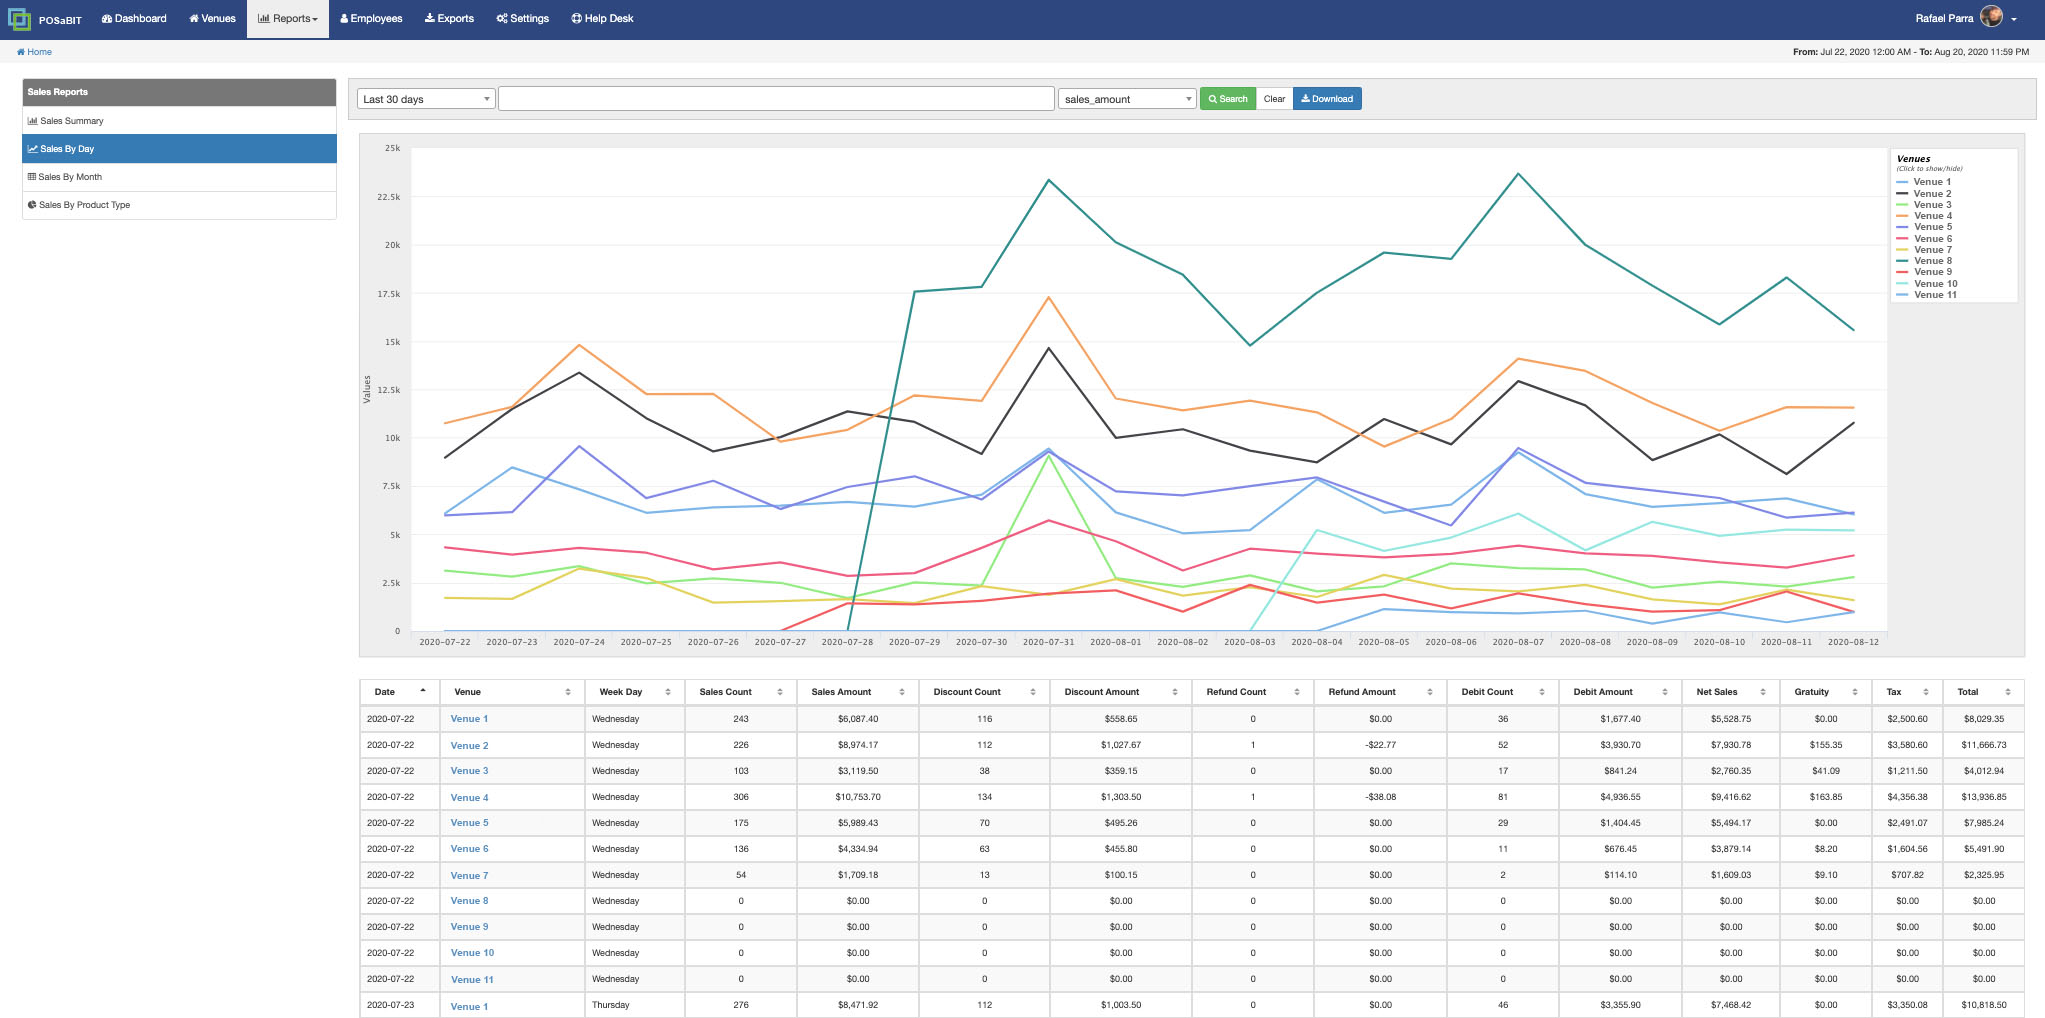
To download a full report with more information, click the Download button located at the top of the screen.
For additional assistance, please reach out to POSaBIT support @ 1 (855) POSaBIT OR SUPPORT@POSaBIT.COM