Merchant Sales Summary Report

The merchant sales summary report is designed to provide a better understanding of the entire company.
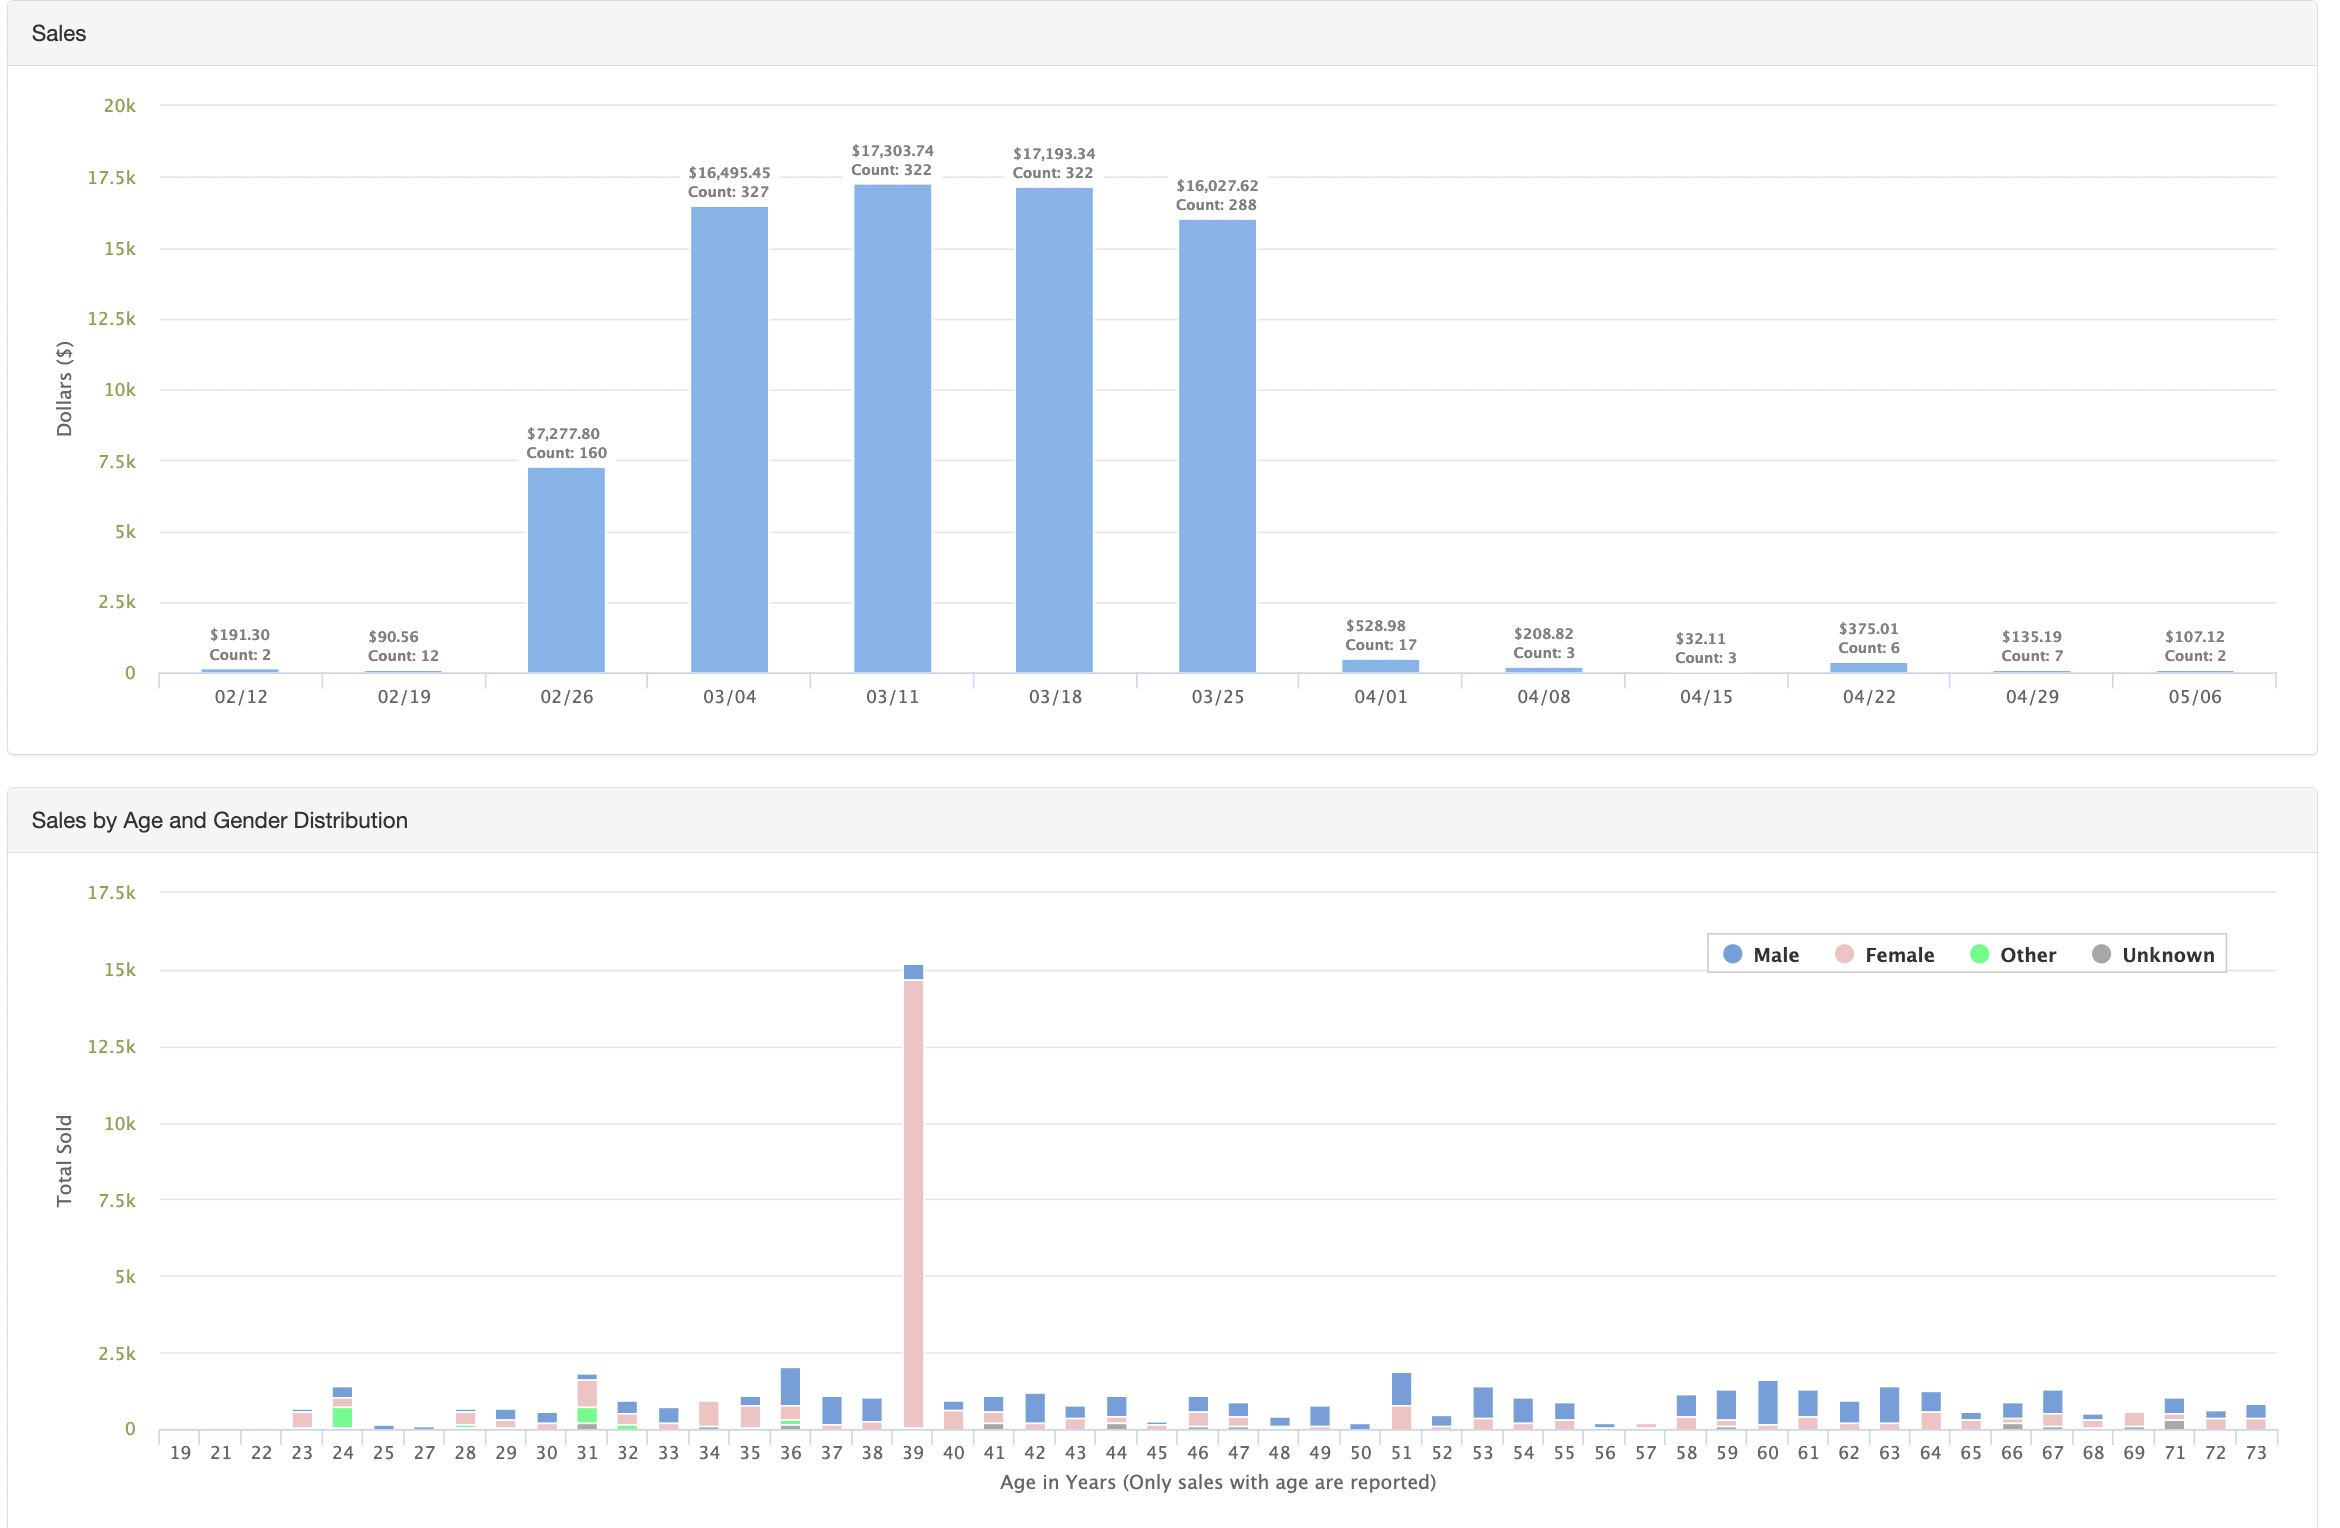
At the top of the screen, you will find a basic sales graph. This graph can be toggled to display all venues' sales data together or by individual stores. Under this graph is a simple table that displays merchant-wide data broken up by walk-ins, online pickups, and online delivery (if enabled).
There is a second table that is a stacked bar chart displaying "Sales by Age and Gender Distribution". This graph breaks down all venues sales data by age and gender. This allows you to get a better understanding of your main demographics for all venues.
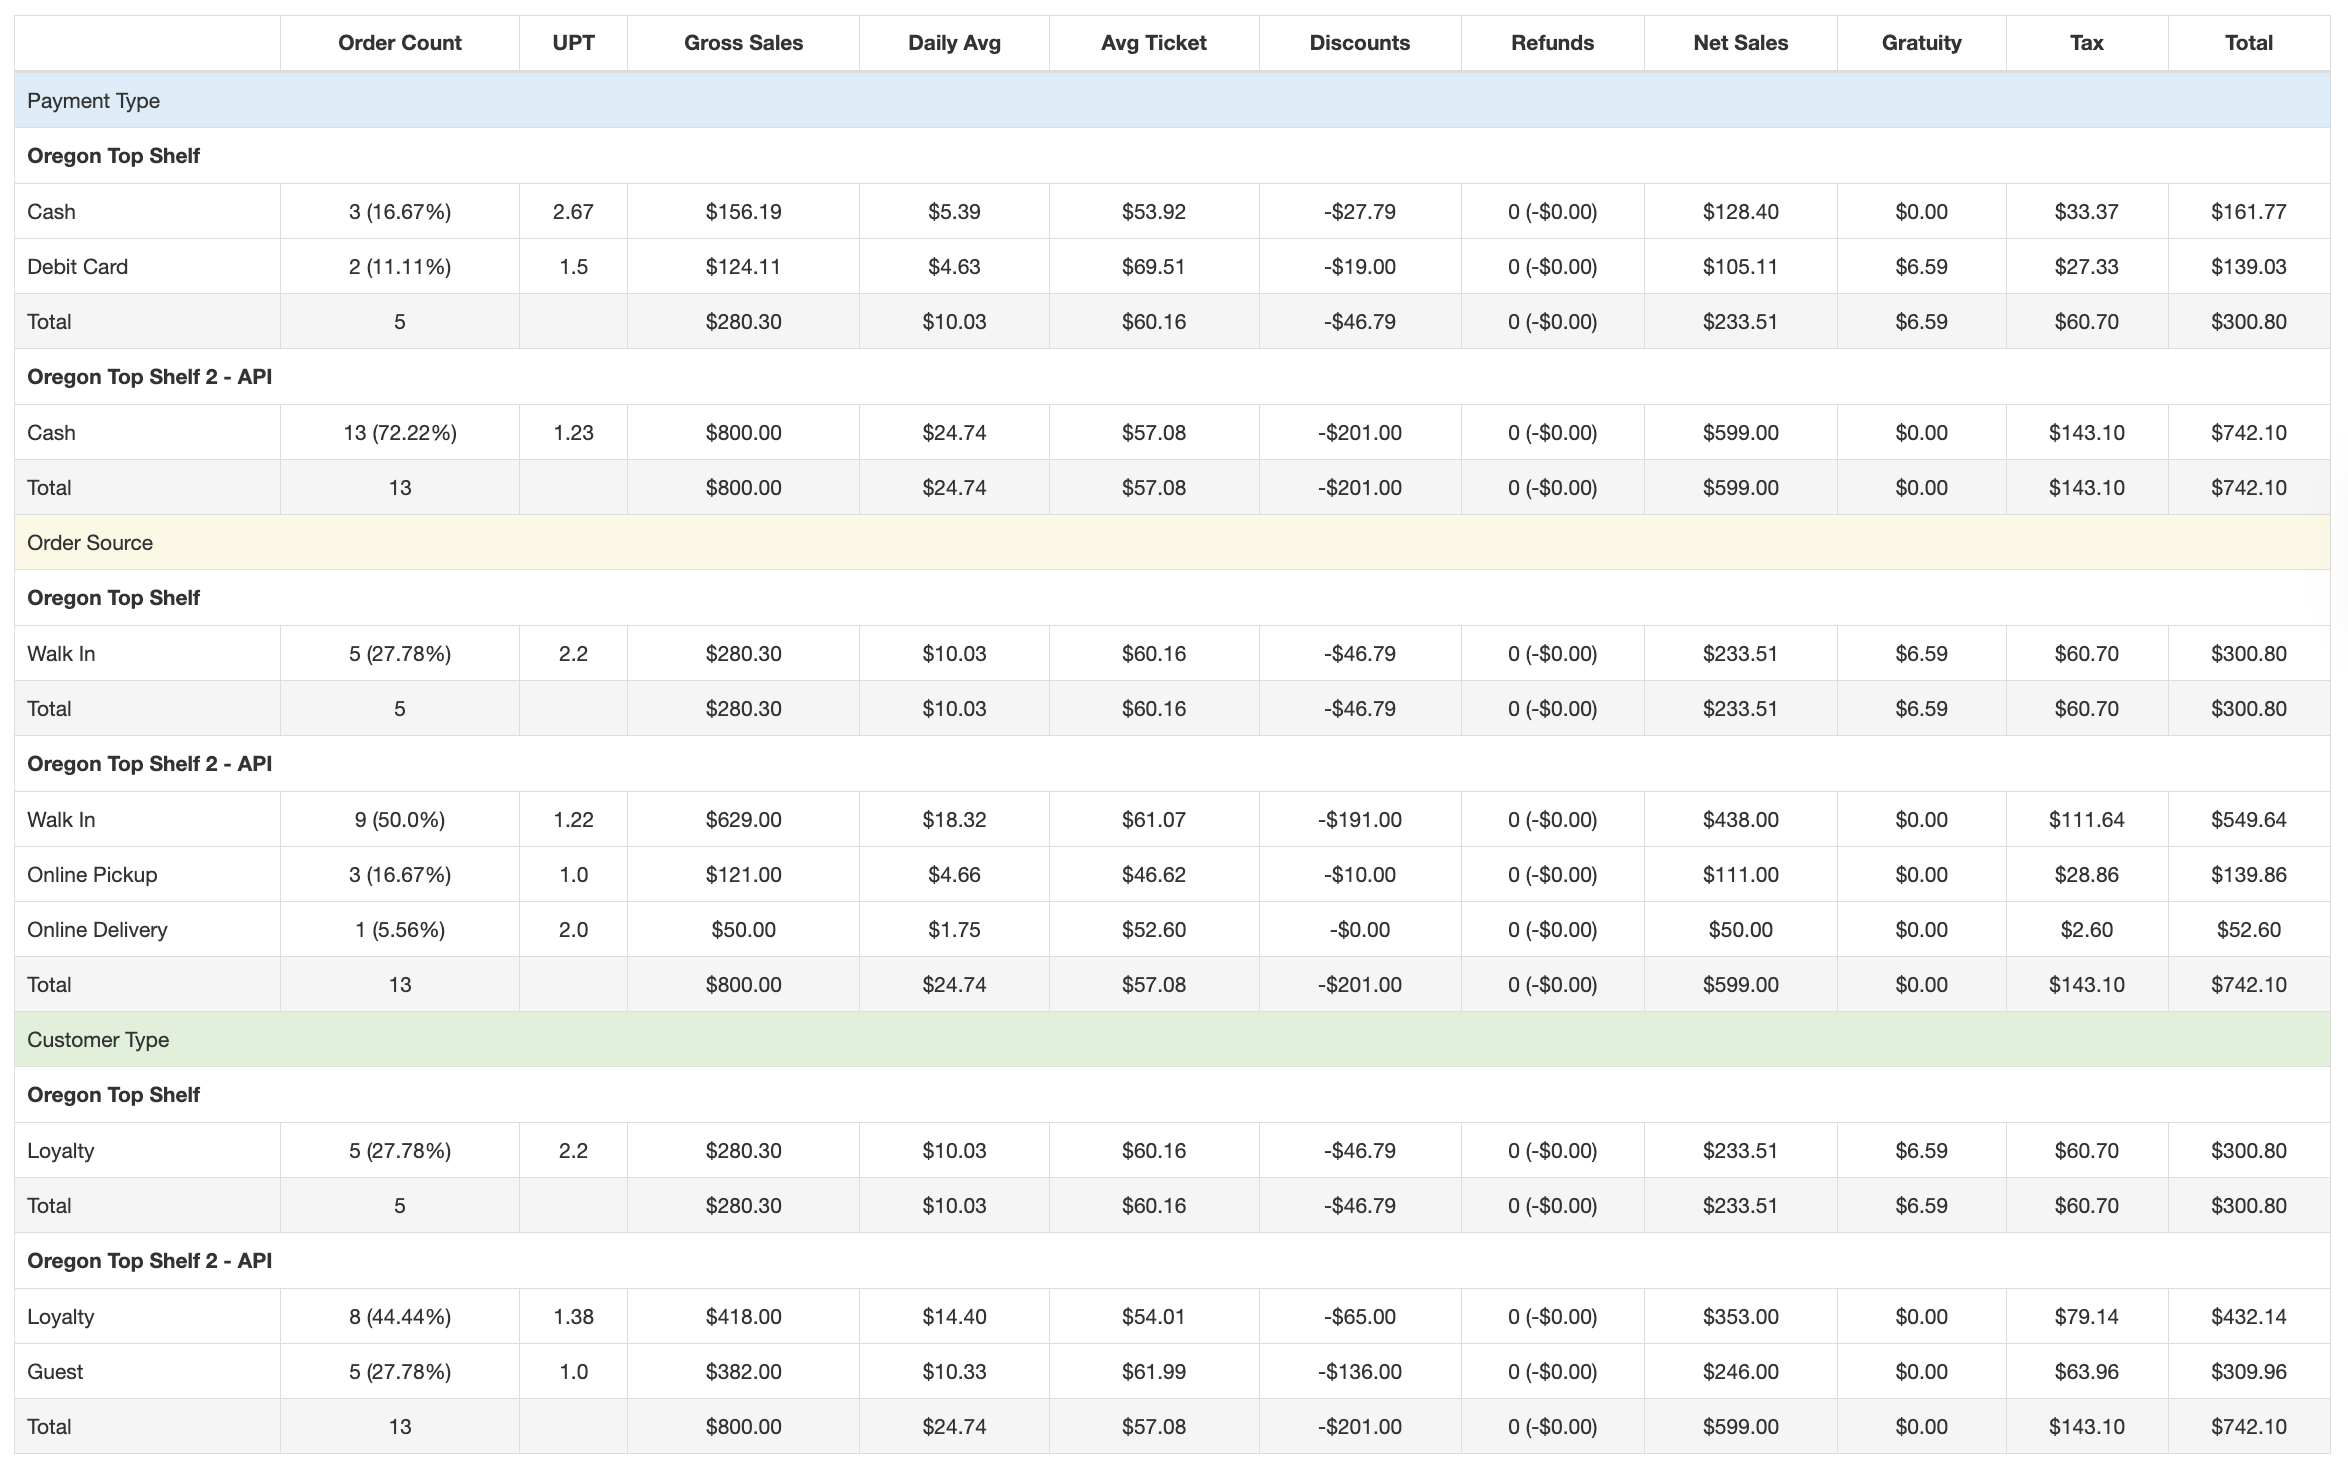
Finally, a table is used to display general sales metrics broken down by venue. This table is meant to show an overview of the different venues for simple comparison purposes.
To download a report with more information, click the Download button located at the top of the page.
For additional assistance, please reach out to POSaBIT support @ 1 (855) POSaBIT OR SUPPORT@POSaBIT.COM