Merchant Dashboard Reports

The Merchant dashboard provides a general overview of all venues under the merchant account. This includes merchant-wide data such as net sales and sales count, as well as venue-specific data. This dashboard can easily be used to directly compare venue data, such as transaction count, sales numbers, and profit.
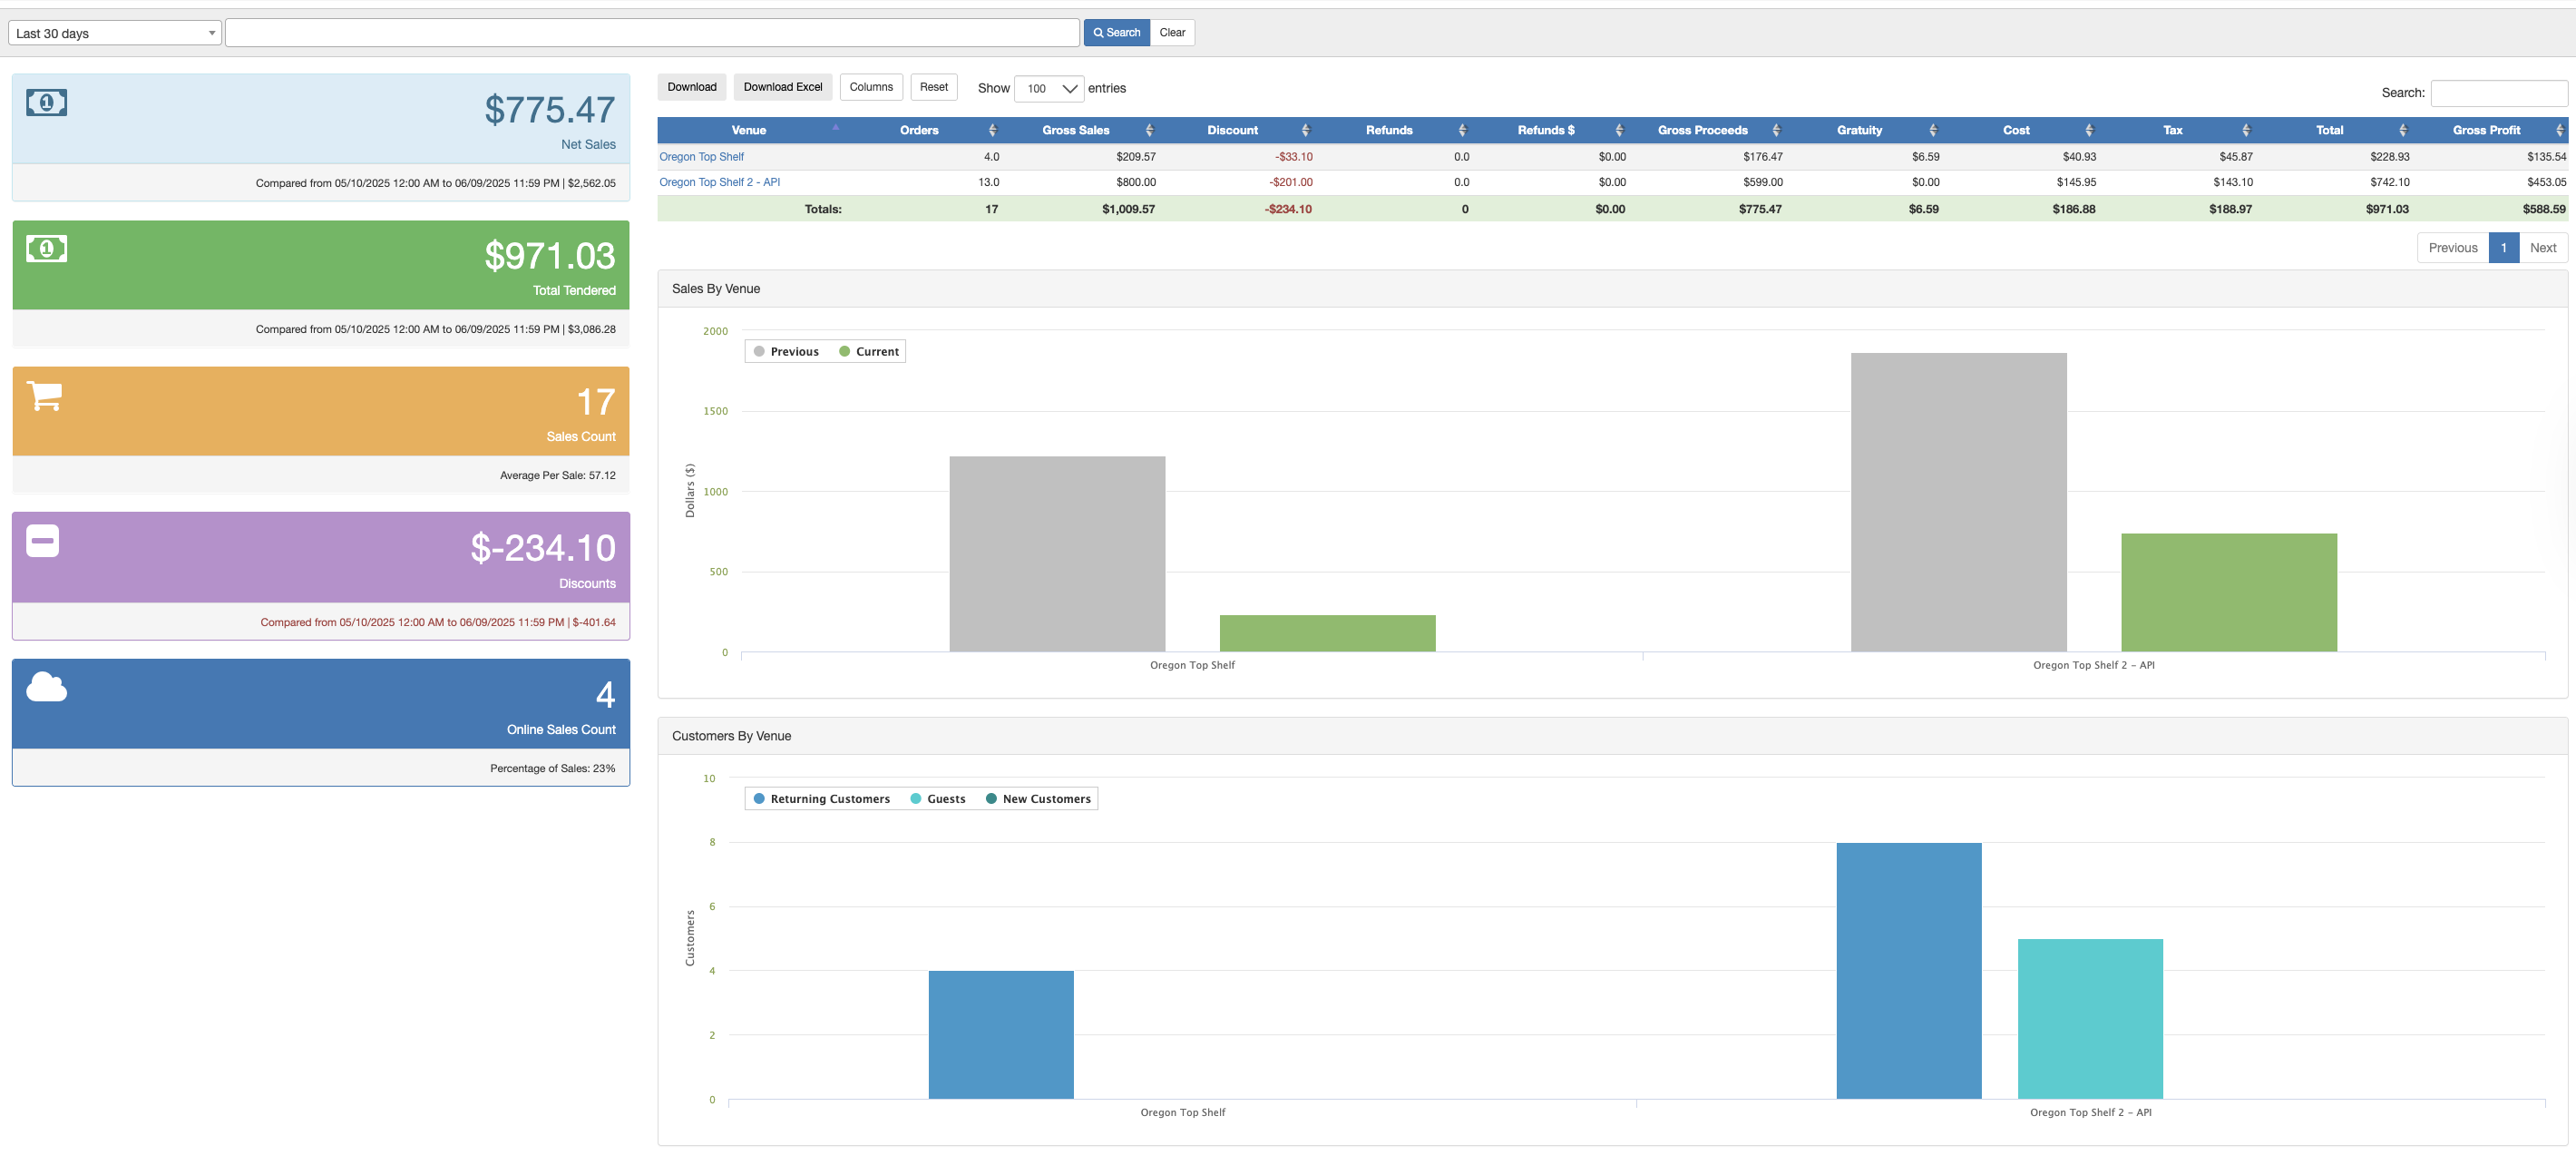
On the left side of the screen, you will see the merchant wide data, such as net sales, total tendered, sales count, online order count, and discounts. This data is meant to display a very broad view of how the entire company is doing as a whole. Additionally, under these boxes is a pie chart displaying "Sales by Product Type".
On the right side of the screen, you will find more venue-specific data. Near the top of the screen is a table breaking down different sales data for each venue under the merchant account. Under this table, you will find a bar graph displaying "Sales per Venue". This graph displays the current time period's sales vs. the previous time period. You can adjust the specific time period that is used here at the top of the screen. Lastly, is the "Customers by Venue" graph. This graph breaks down how many of your customers were returning, guests, and new customers per venue. This graph can be really helpful in identifying what demographic shops at each of your venues.
Filtering the Report:
Included in this report are a few filtering options, such as:
- Time Period
- Specific Venue (Dropdown)
- Columns: Select or unselect the columns to hide or show specific columns.
To download a full report with more information, click the blue Download or Download Excel button located at the top of the screen.
For additional assistance, please reach out to POSaBIT support @ 1 (855) POSaBIT OR SUPPORT@POSaBIT.COM