Sales by Customer Tag Report

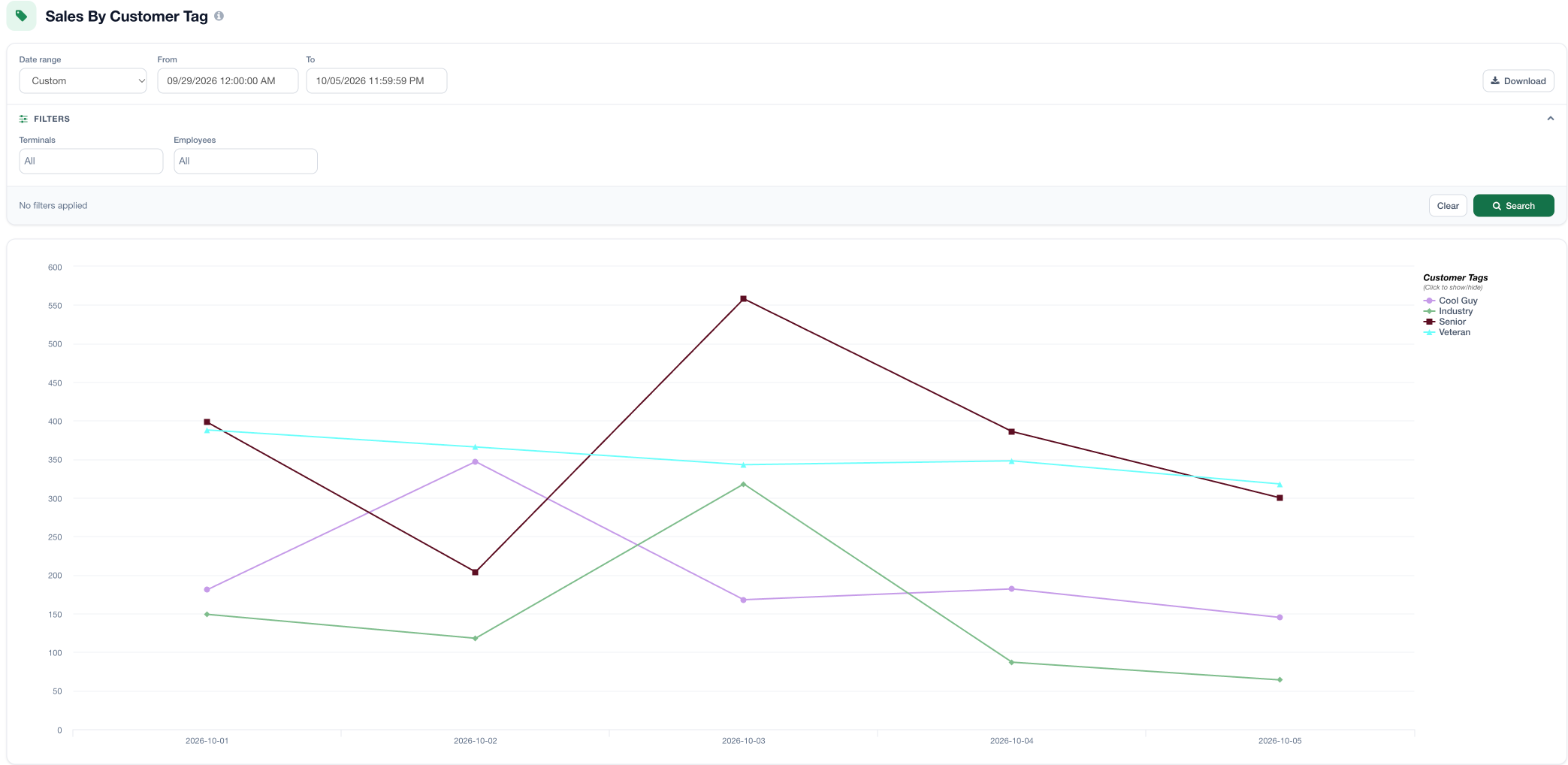
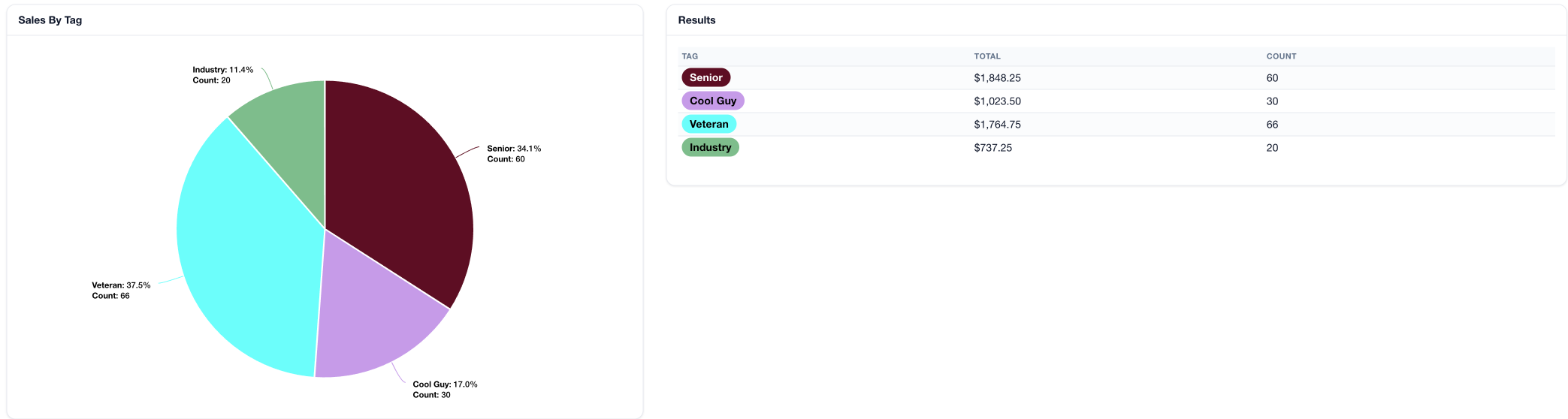
The Sales by Customer Tags report provides you with various data visuals to help you track sales of different customer tag groups. On this report page, you'll find a line chart showing sales over time, a pie chart, a condensed data table showing total sales and the count of items sold by customer tag, and a bar chart at the bottom showing a breakdown by order source. Using the legend to the right of a chart, click on a tag to show or hide it.
Download the report by clicking the Download button at the top right of the report.
For additional assistance, please reach out to POSaBIT support @ 1 (855) POSaBIT OR SUPPORT@POSaBIT.COM