Sales by Month Report

The Sales by Month report tracks various sales metrics over time to help you better identify long-term trends.
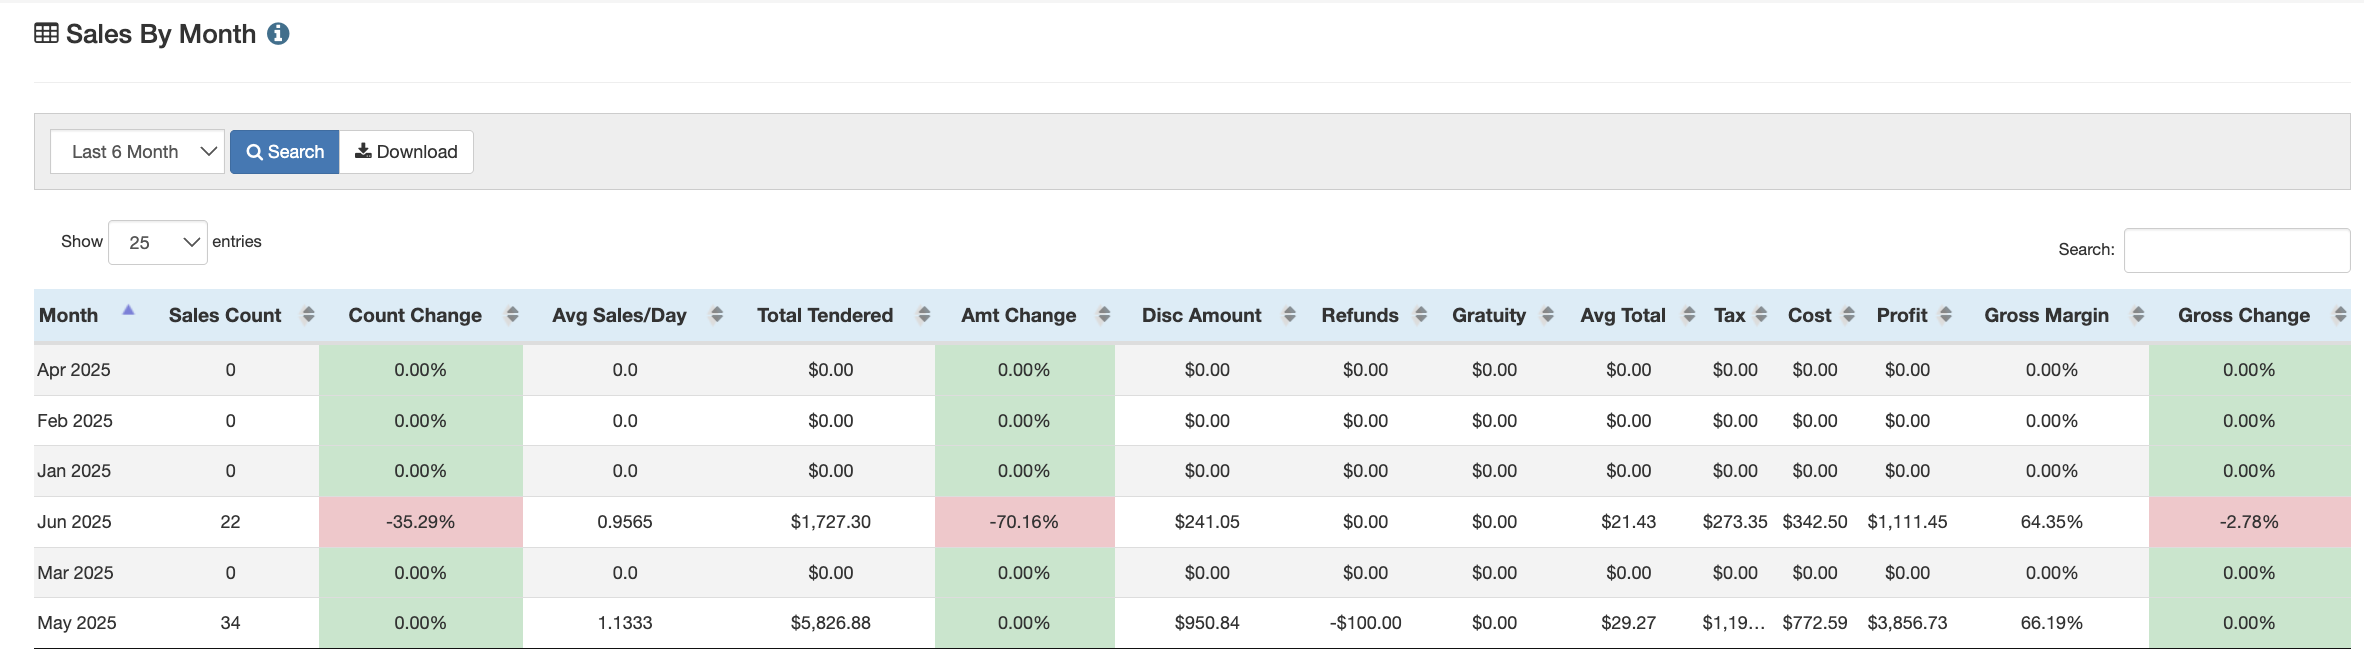
To run this report, first set the start and end month dates that you wish to see in the report. Once selected, press the blue Search button. This report is a great monthly breakdown of different sales metrics. The table contains metrics such as sales count, Avg sales/day, sales amount, refunds, etc. Additionally, the Count change, Amt change, and Gross change metrics are calculated in real time to reveal how your venue is performing compared to the previous months. These three metrics are color-coded to make it even easier to identify changes. Green cells symbolize months where there was growth, and red indicates a 'down' month (in comparison to the previous month).
To download a full report with additional metrics, press the Download button at the top of the report.
For additional assistance, please reach out to POSaBIT support @ 1 (855) POSaBIT OR SUPPORT@POSaBIT.COM