Sales by Product Type Report

The Sales by Product report provides you with a sales summary of totals by product type, over any given date range. There are two versions of this report and you can easily switch between them using the orange button in the top right corner of the page. There is a "Legacy report" and a "V2 Report". See below for a breakdown of both:
V2 Report
The V2 report includes a table with sales information related to the different product types, along with a pie chart below to see more of a visual representation of sales. The V2 report is also customizable, so you can display more specific data. At the top of the report, there is an assortment of filter options, which will also help you narrow down the report.
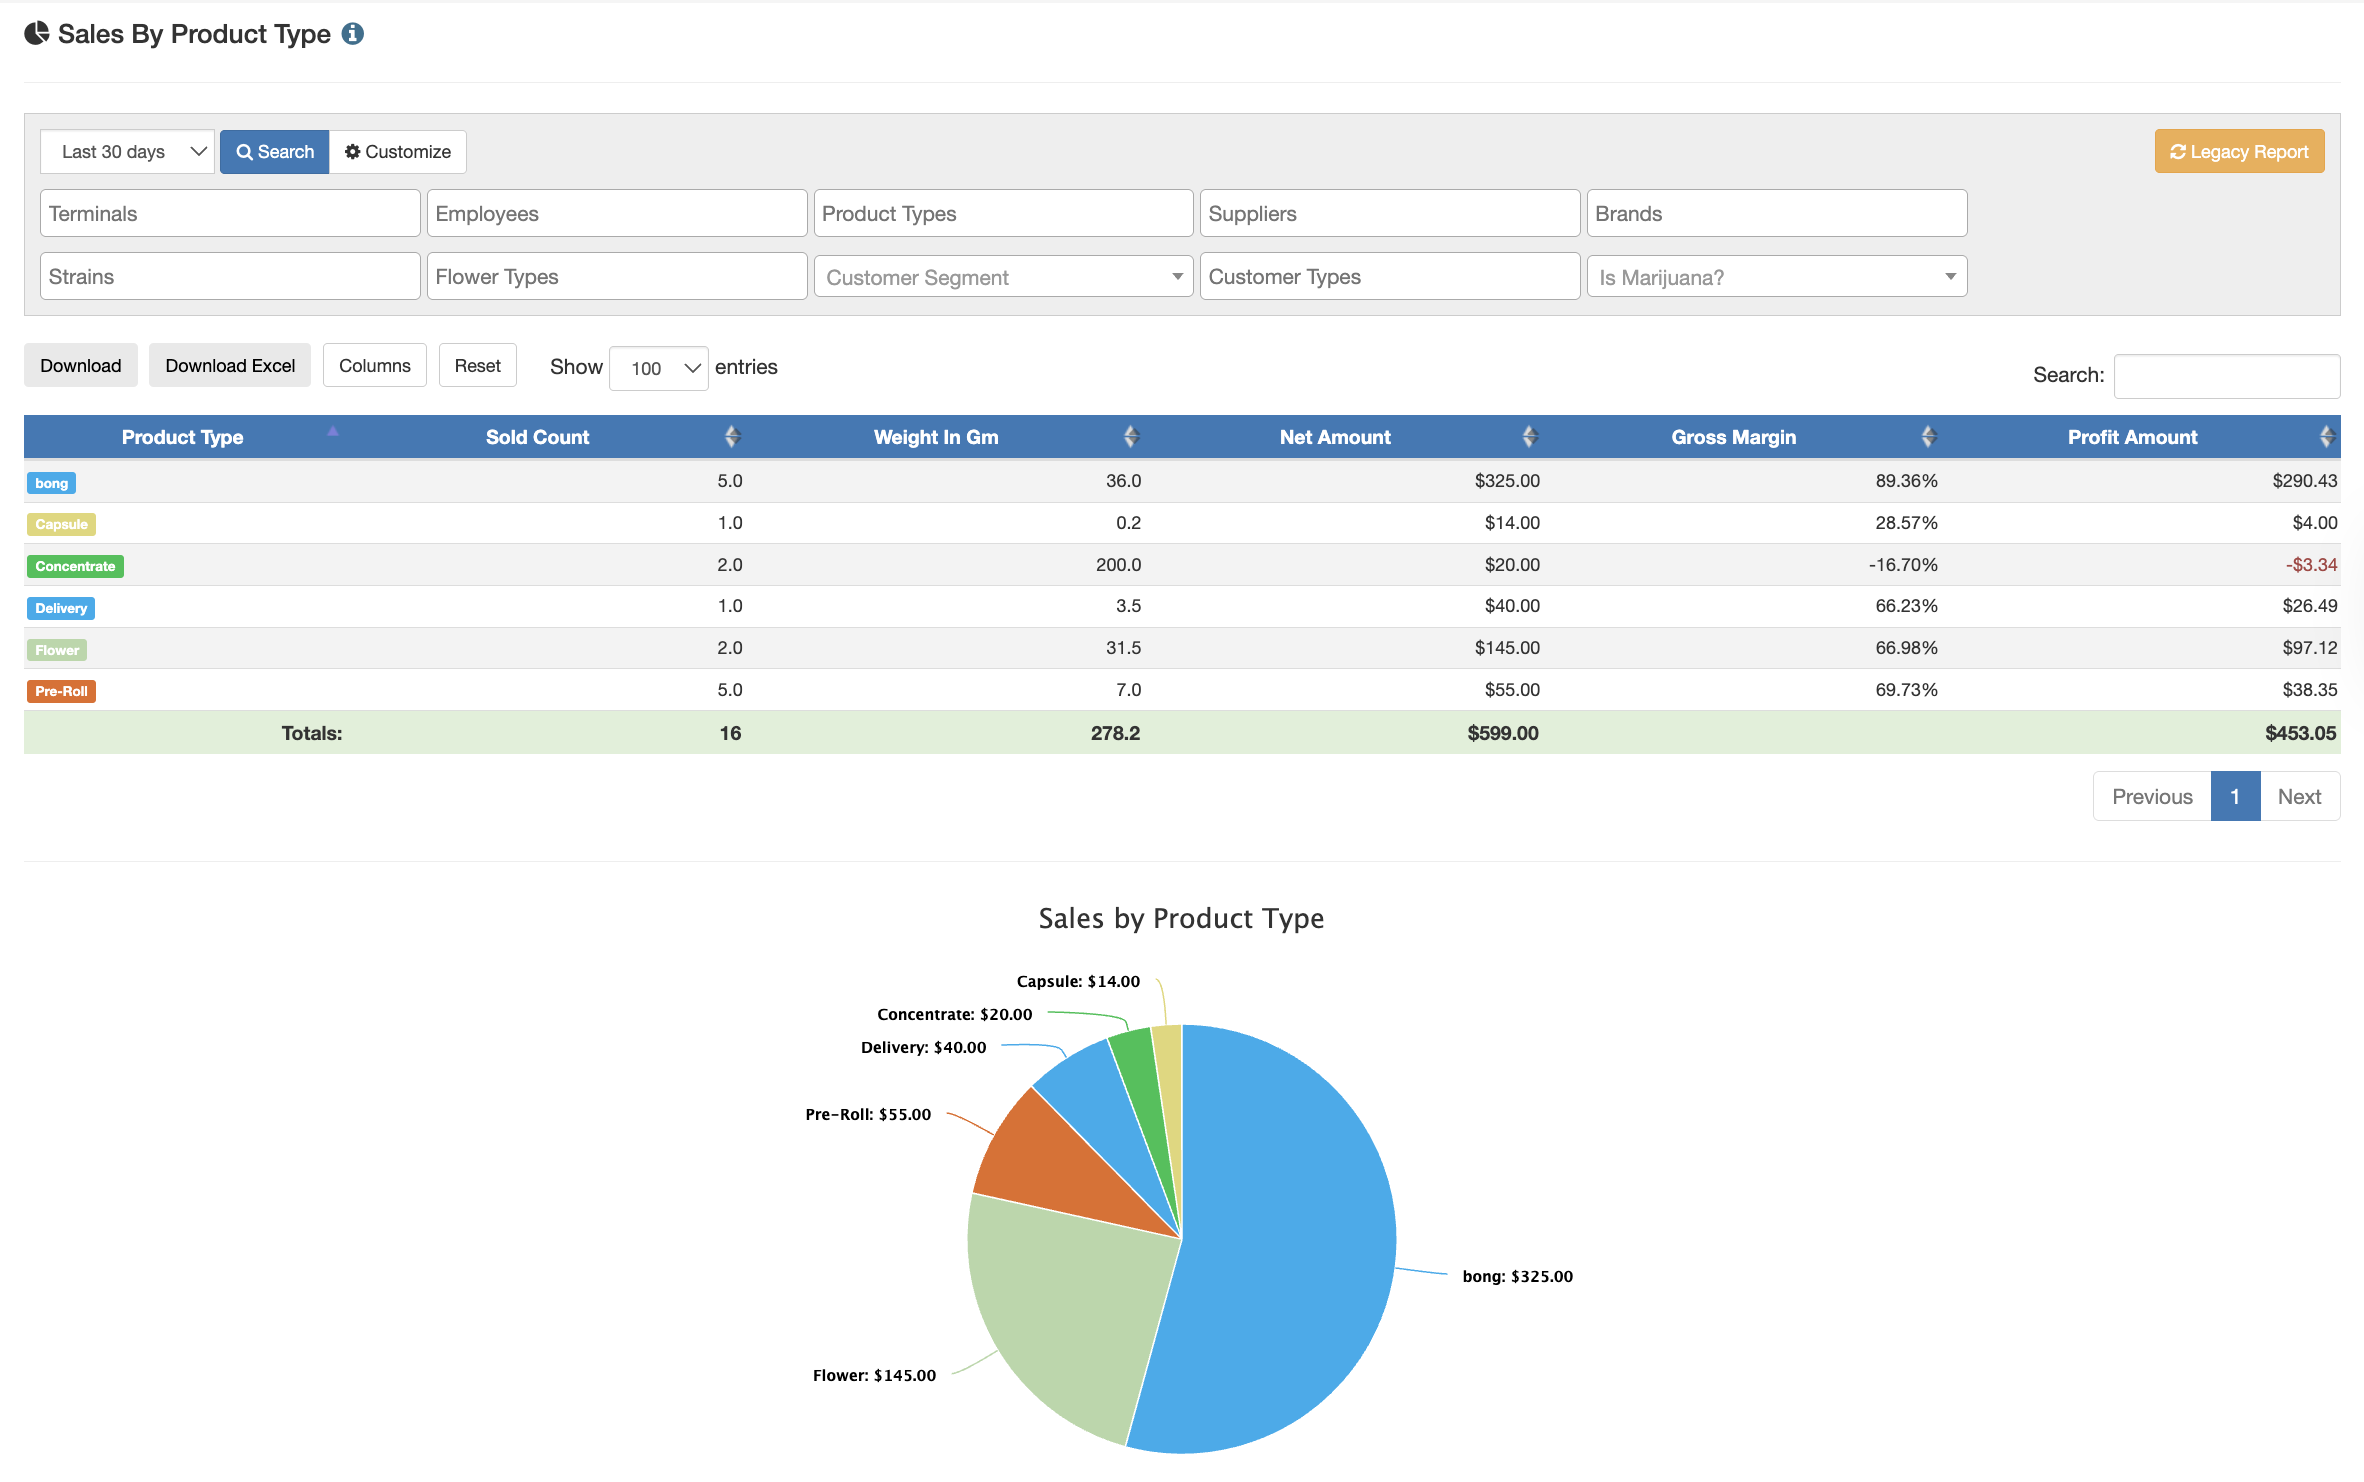
Customize this Report:
To the right of the search bar, there is a "Customize" button. Click this to customize your report, and you can even save the report to be used again. Learn all about custom sales reports HERE.
Download the Report:
Click the Download or Download Excel button at the bottom of the filters portion of the page to download this report.
Legacy Report
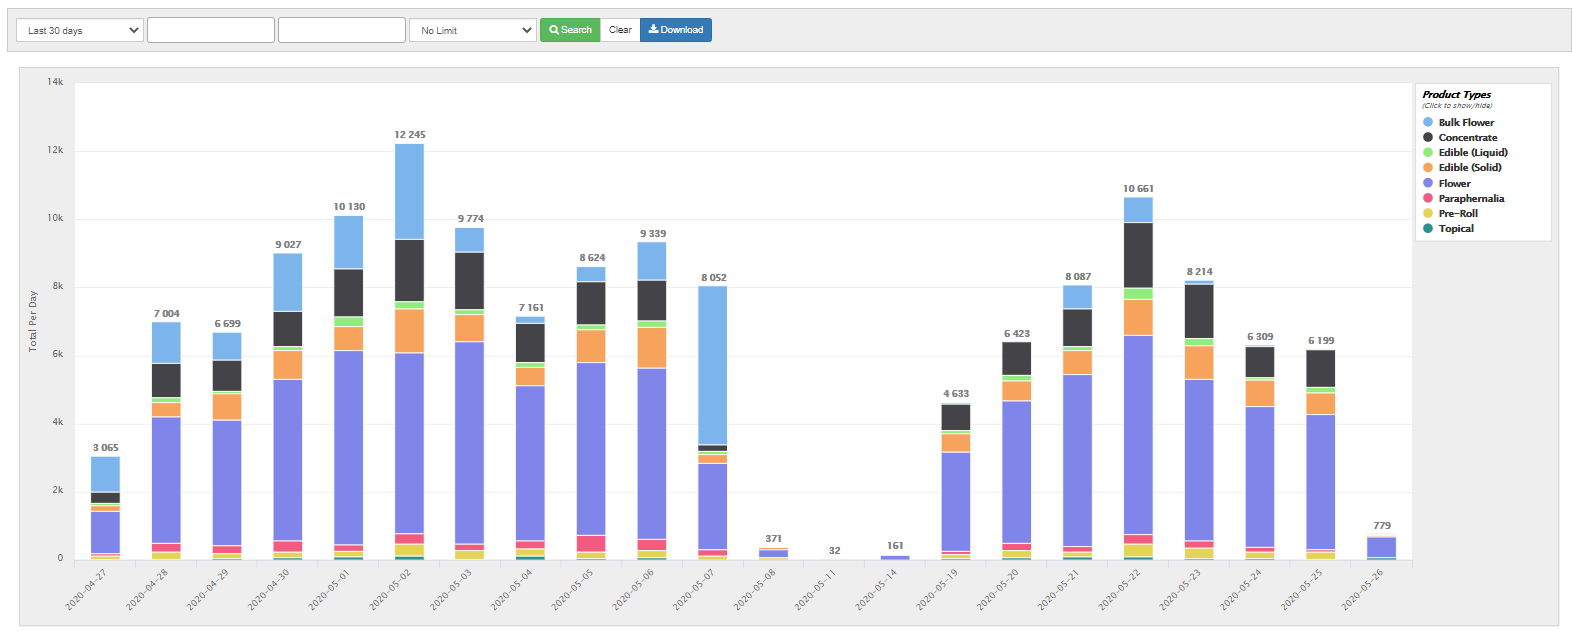
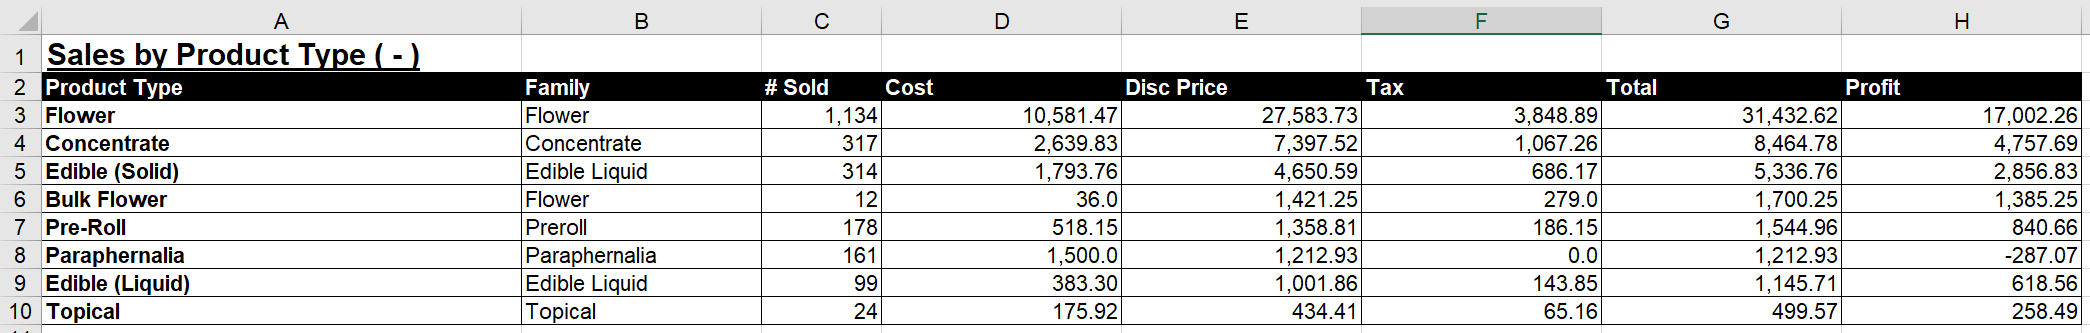
At the top of the Sales by Product page, you will find an interactive bar graph, that gives you a visual of sales by day, or week - depending on the date range that is selected. Using the legend to the right of the chart, click on a label to toggle any product type on/off from being displayed on the graph.
Below the chart is a pie chart and a condensed data table full of sales information, which is broken out by product type. If you'd like to dive deeper into any particular type, click on the name (hyperlink) of the type from the data table to view additional metrics for a specific product type.
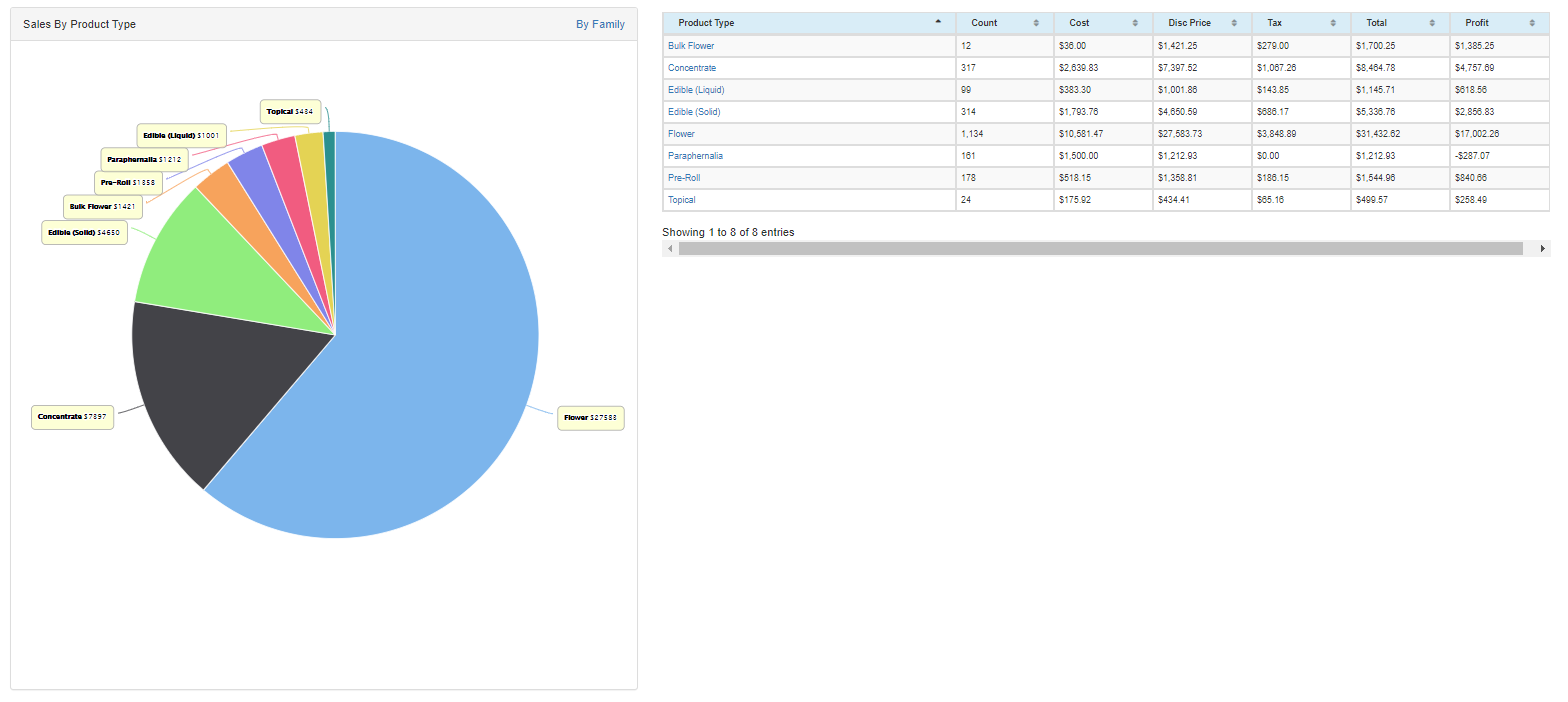
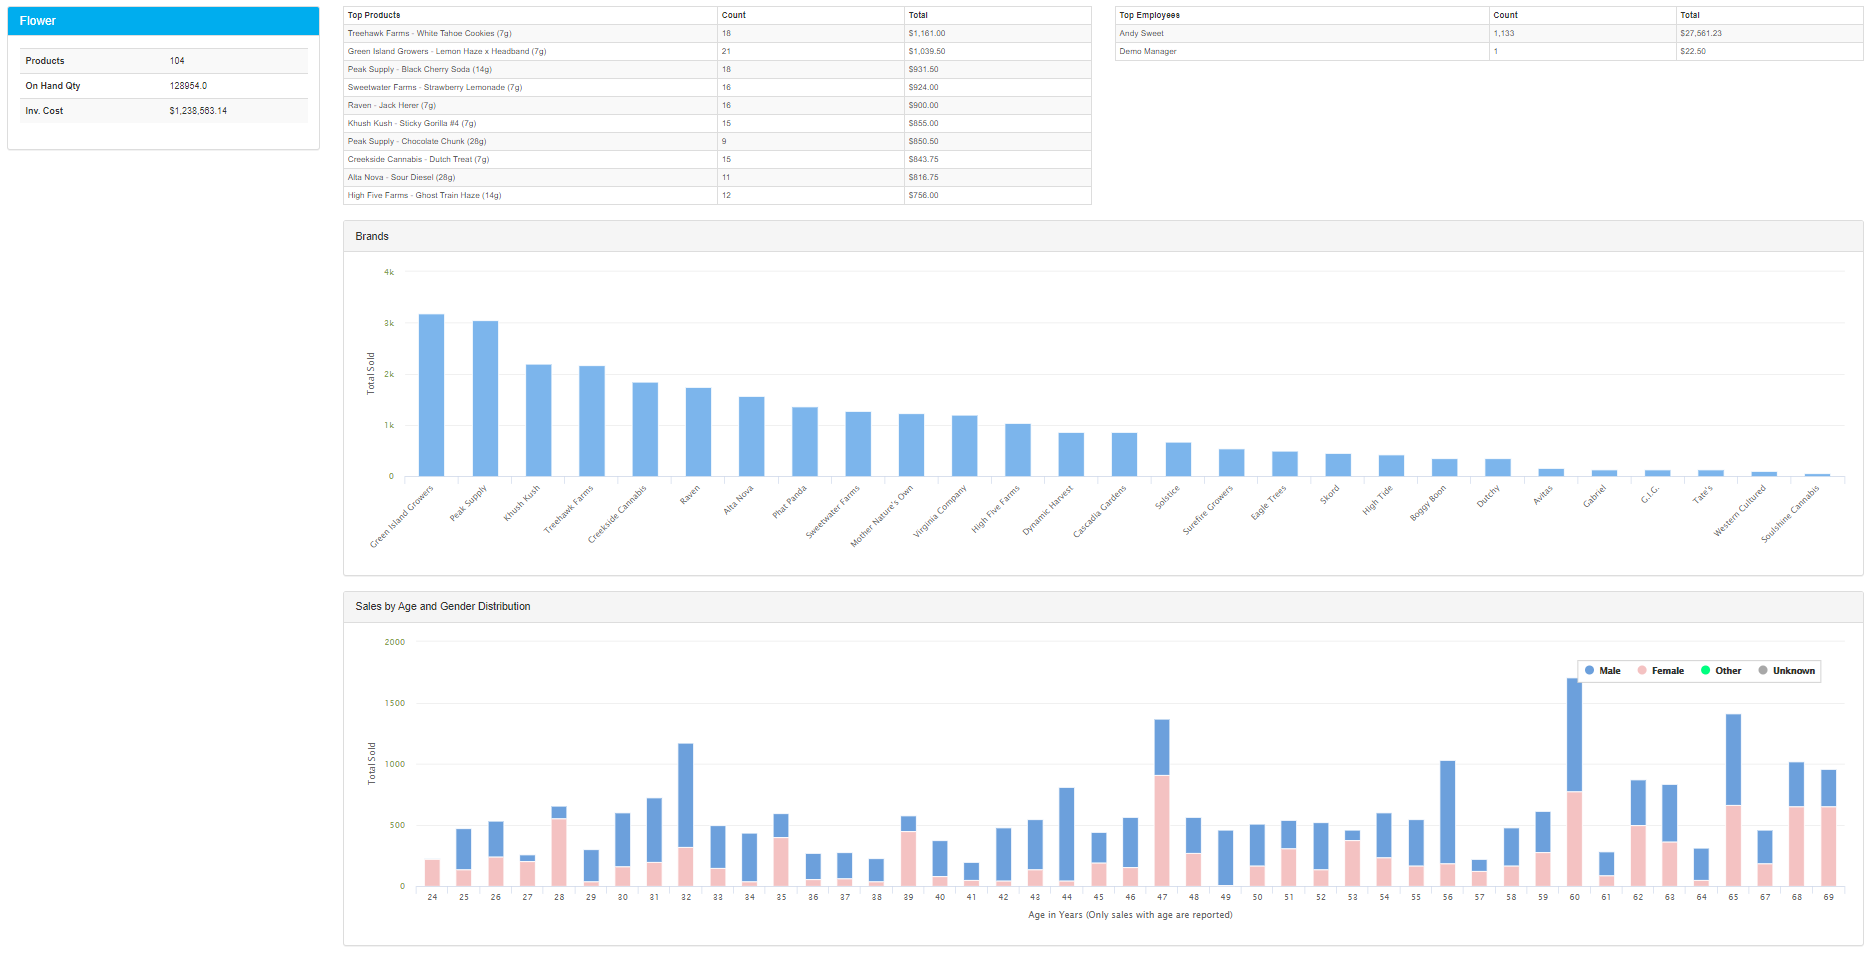
Additional metrics for each product type include:
- Number of products
- On hand quantity
- Inventory Cost
- Top Products
- Sales by Employee
- Sales by Brand
- Sales by age/gender
Click the download button at the top of the Sales by Product Type page to download the report as an Excel file.
For additional assistance, please reach out to POSaBIT support @ 1 (855) POSaBIT OR SUPPORT@POSaBIT.COM