Inventory Value History Report

The Inventory Value History report tracks the total costs vs. retail price of products sold, so you can better monitor your profits.
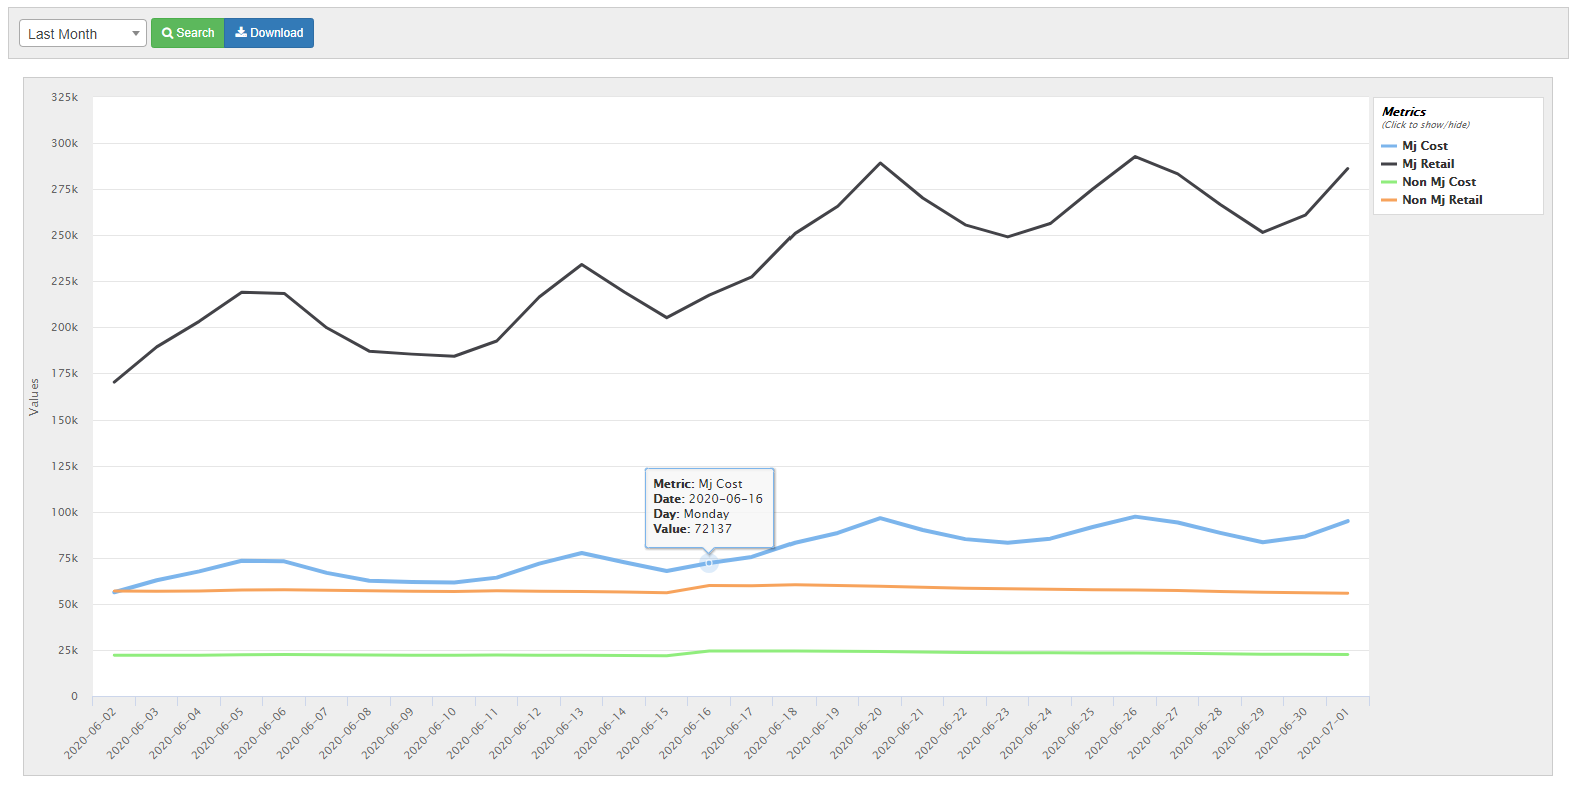
The diagram at the top of the page displays the total costs and retail price for products per day. This diagram can be used to monitor how much your venue is spending on products as well as the retail price you are charging for them. Additionally, when hovering over parts of the graph, you can see the exact values for each specific day.
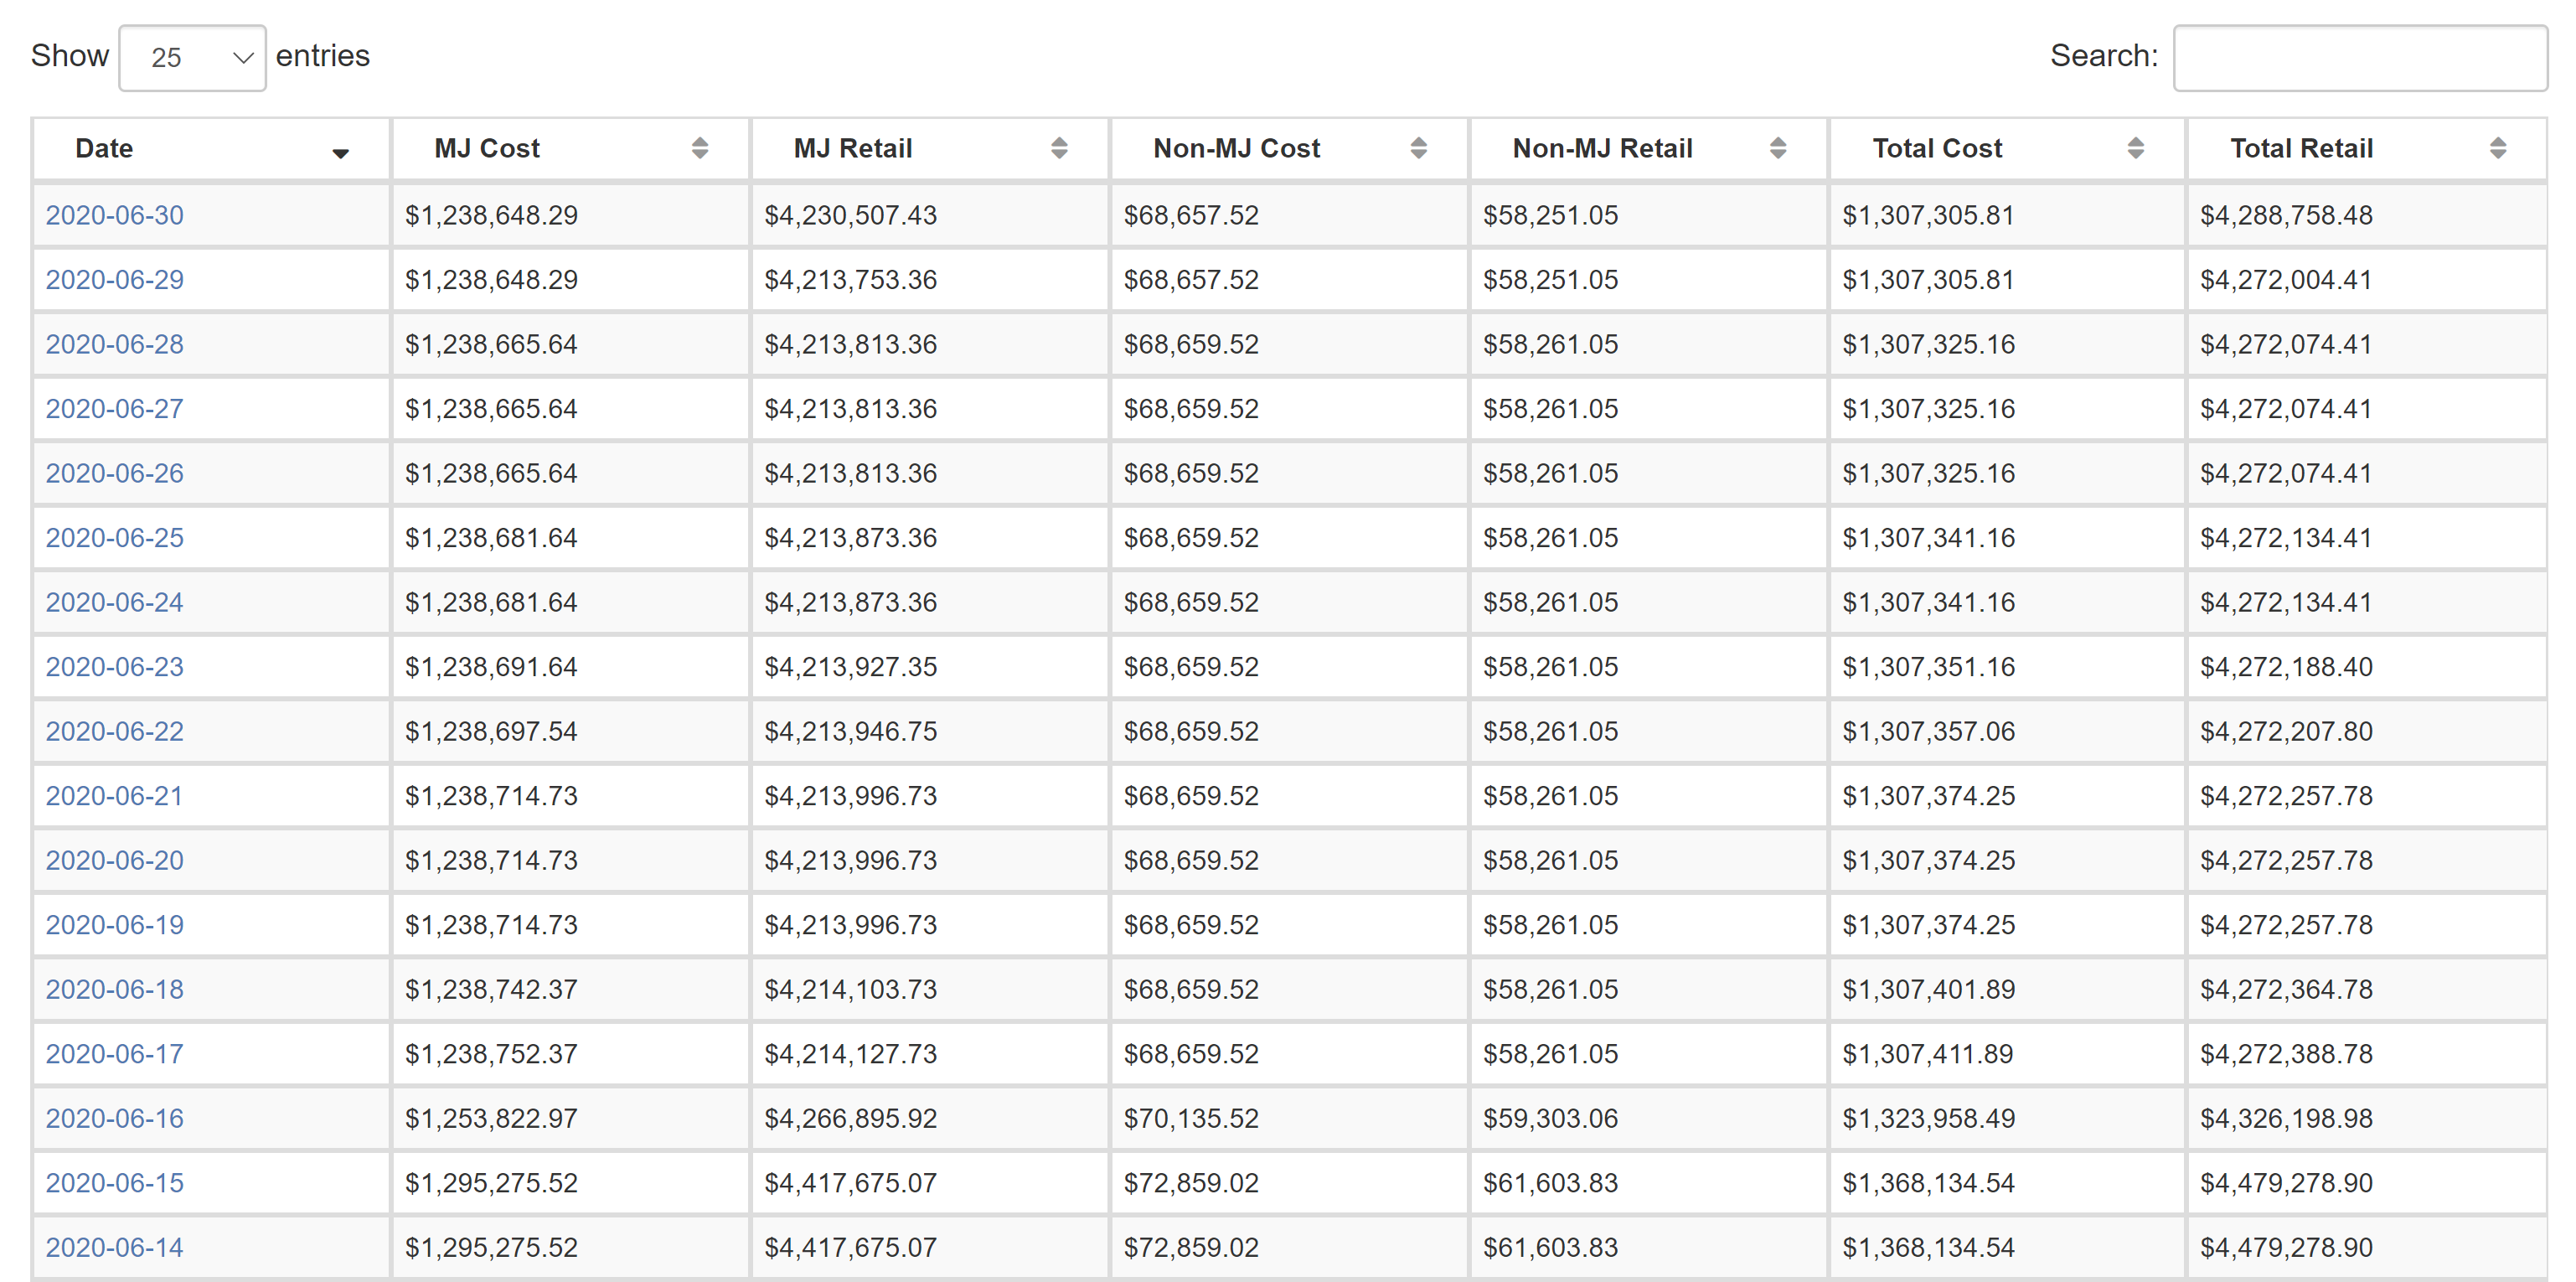
Below this diagram is a table breaking down each day's cost and retail price for both cannabis products and non-cannabis products. This table provides an in-depth look at the cost of the products your venue is selling, as well as the retail price you are charging.
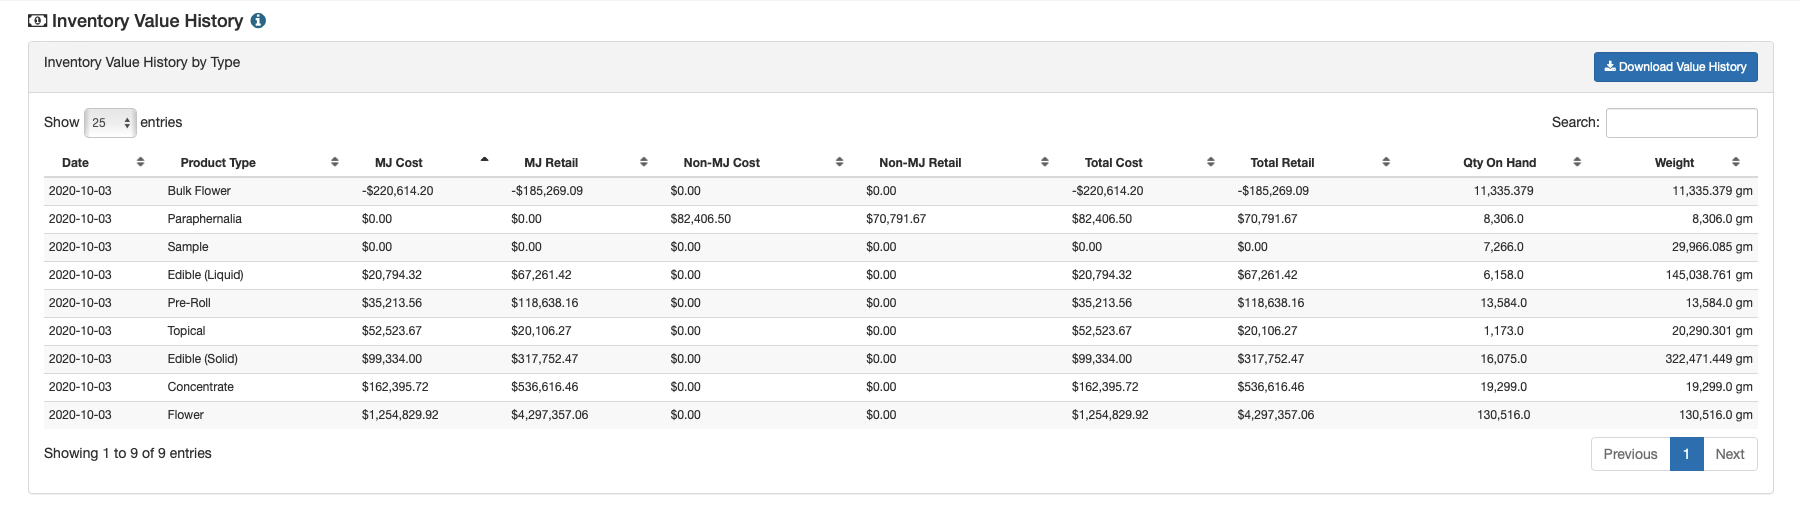
If you'd like to drill down on any given date and view inventory by type, then click on the date in the first column. Once clicked, you'll navigate to a page that shows you the inventory value broken down by each product type. You can download this specific day by clicking the Download Value History button in the top right corner.
To download a full report, click the Download button located at the top of the page.
For additional assistance, please reach out to POSaBIT support @ 1 (855) POSaBIT OR SUPPORT@POSaBIT.COM