Sales by Day Report

The Sales by Day report tracks various sales metrics over time to help you better identify long-term trends.
At the top of the Sales by Day page, you will find an interactive line graph to help spot peak days vs. slower days. Using the legend to the right of the chart, click on a label to toggle any line on/off from being displayed on the graph.
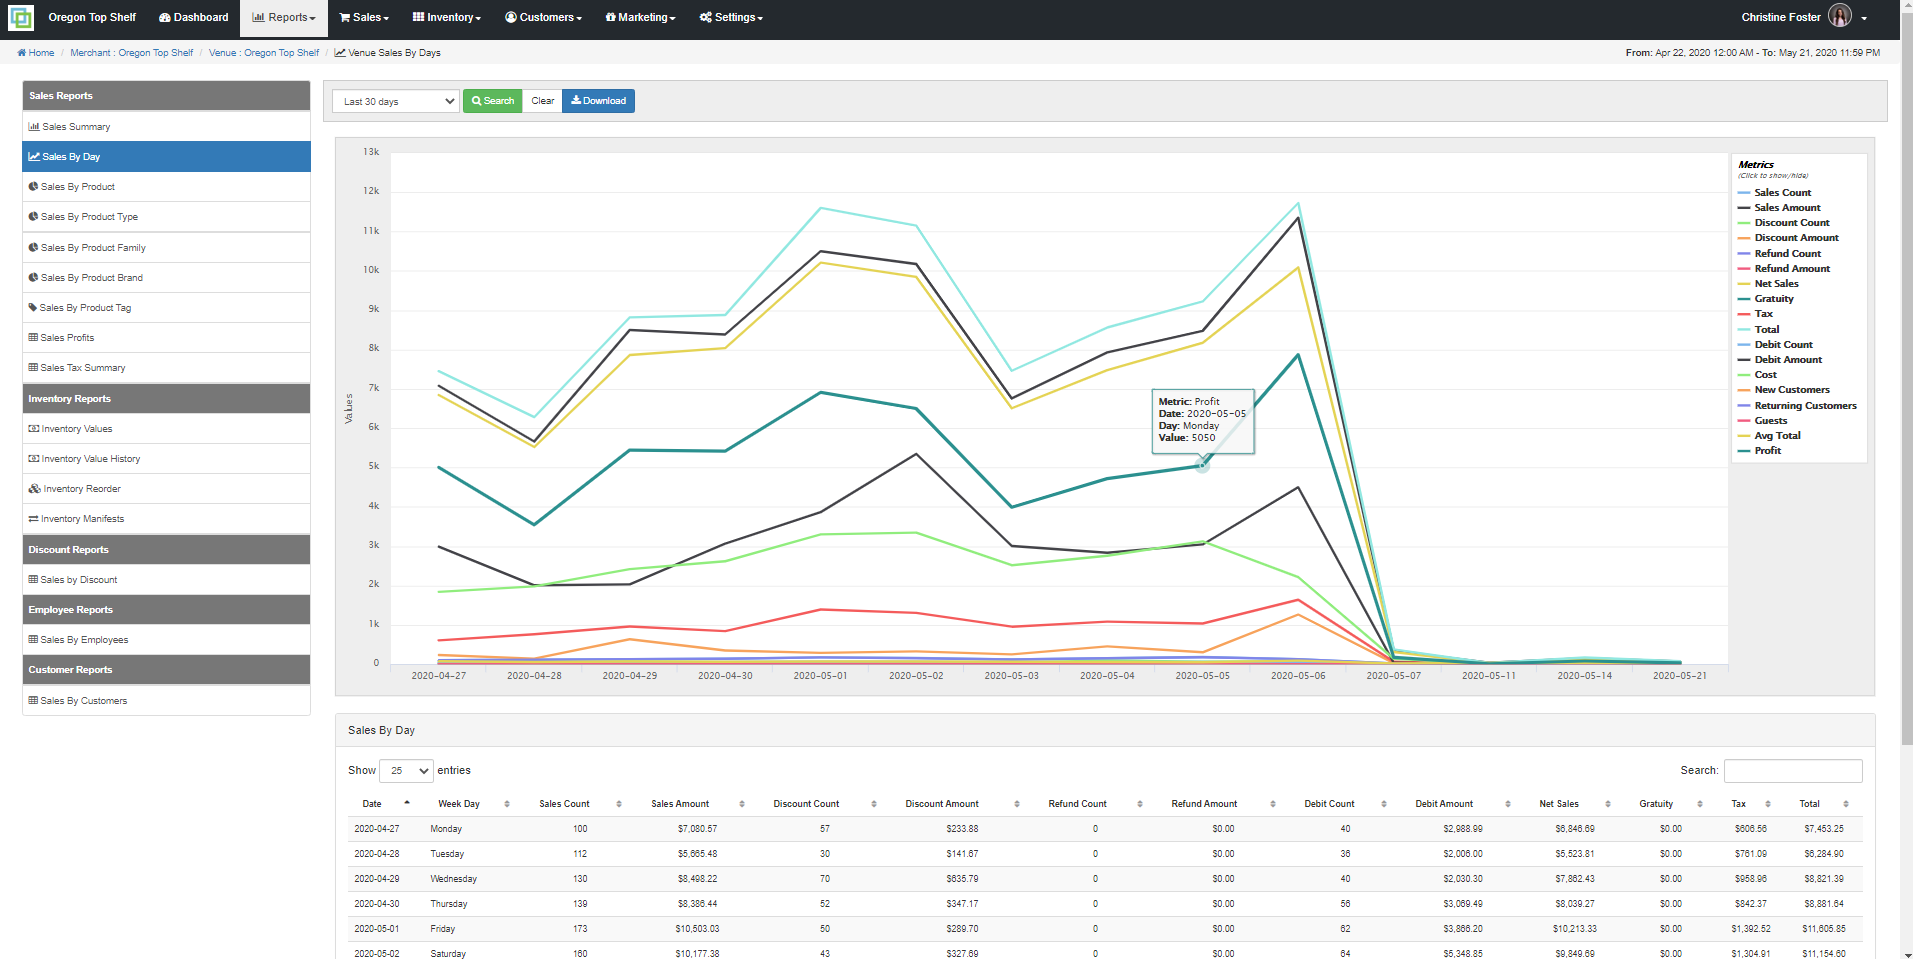
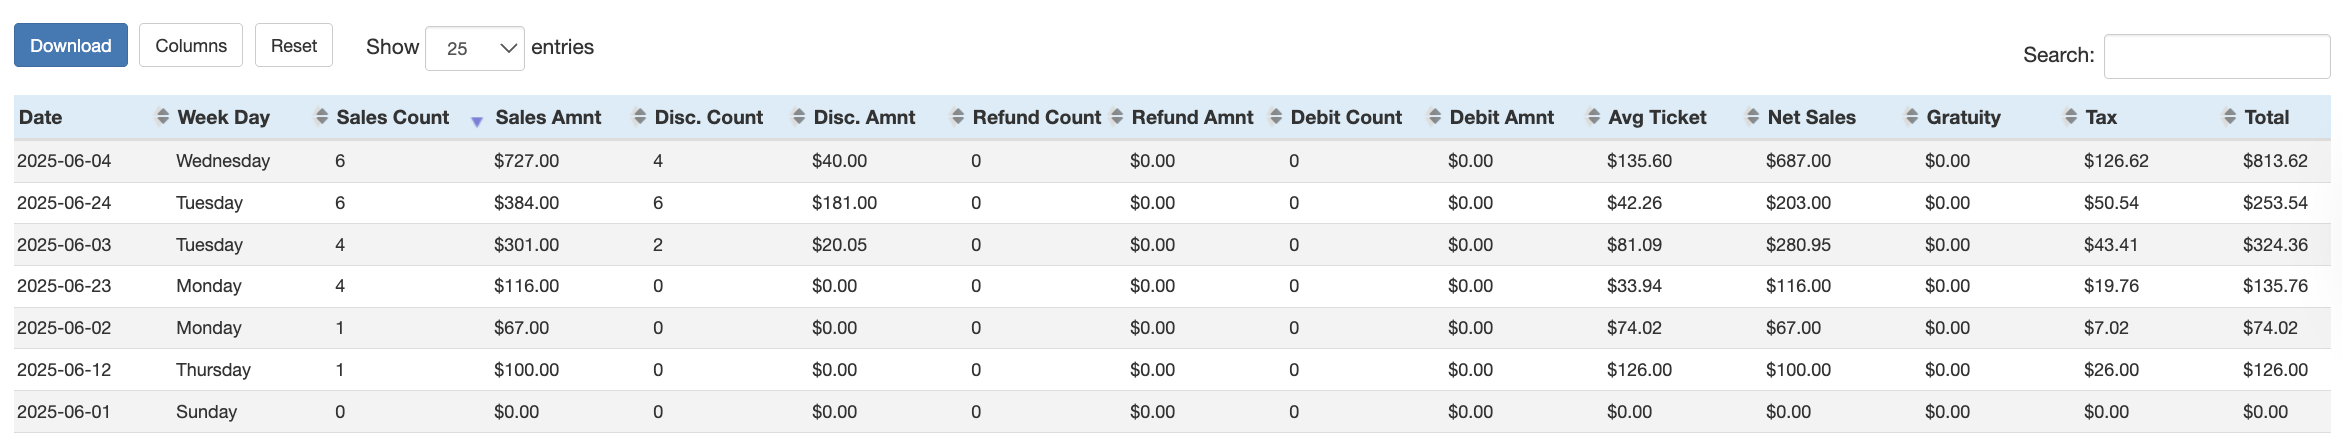
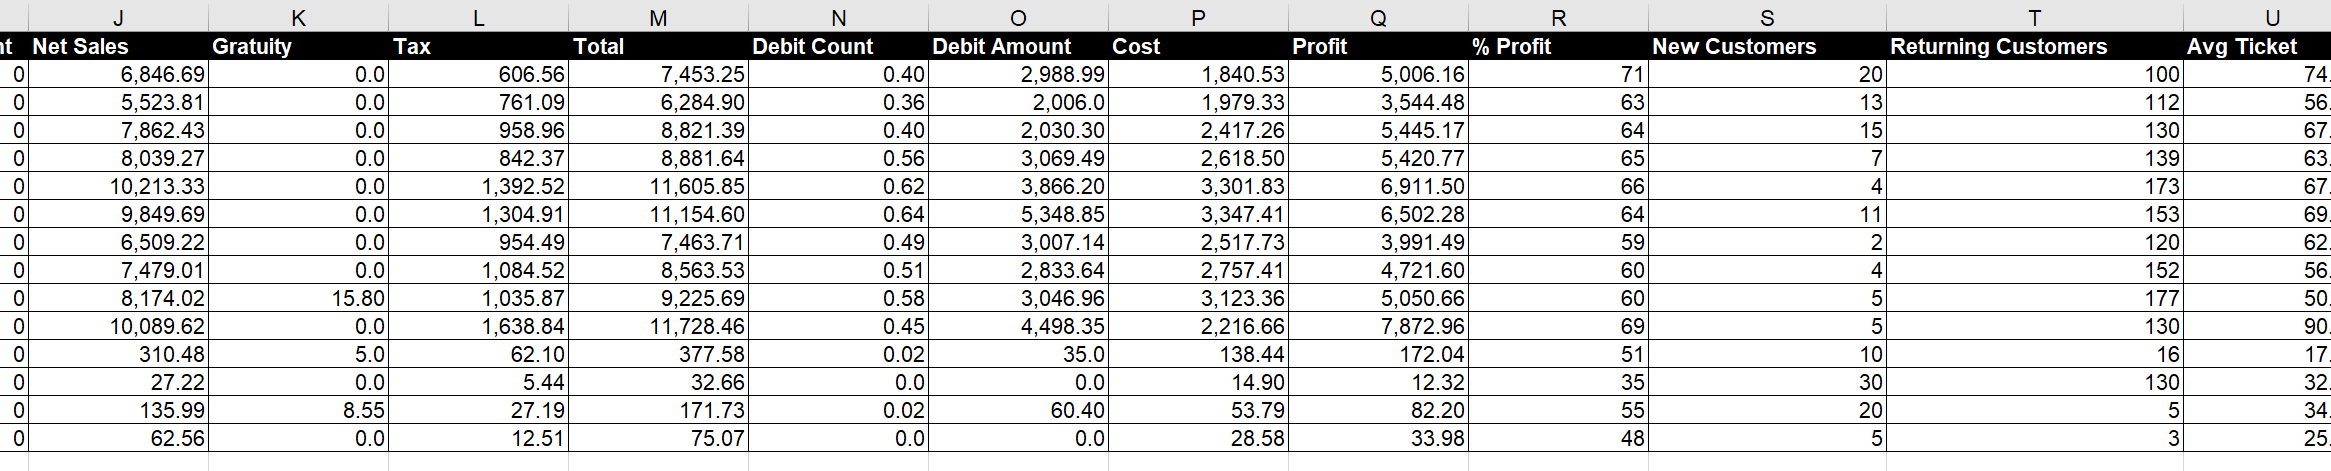
Below the chart is a condensed data table full of sales information that is broken out by day, for any given date range. To download the full report with additional data, click the download button at the top of the table. You can also use the Columns button to hide or show specific columns of the report.
For additional assistance, please reach out to POSaBIT support @ 1 (855) POSaBIT OR SUPPORT@POSaBIT.COM