Sales by Product Brand Report

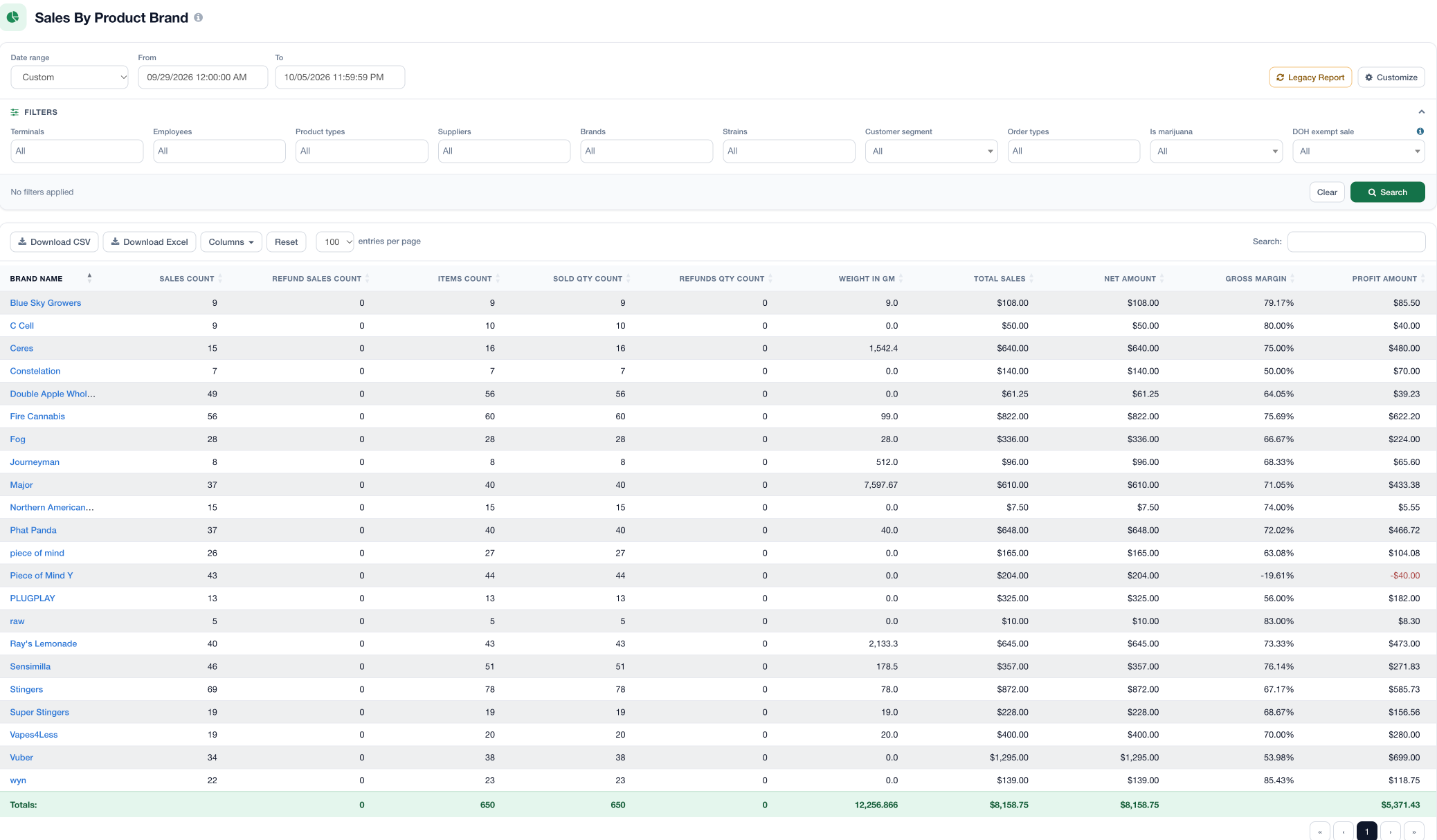
The Sales by Product Brand report provides you with a sales summary of totals by brand, over any given date range. There are two versions of this report, and you can switch between them using the orange button in the top right corner of the page: the V2 Report and the Legacy Report.
V2 Report
The V2 report shows a table with sales information for each brand. Use the filters at the top of the report to narrow down your search, then click Search. Click Customize at the top right to turn it into a custom sales report, or click Download CSV or Download Excel to download it.
Legacy Report
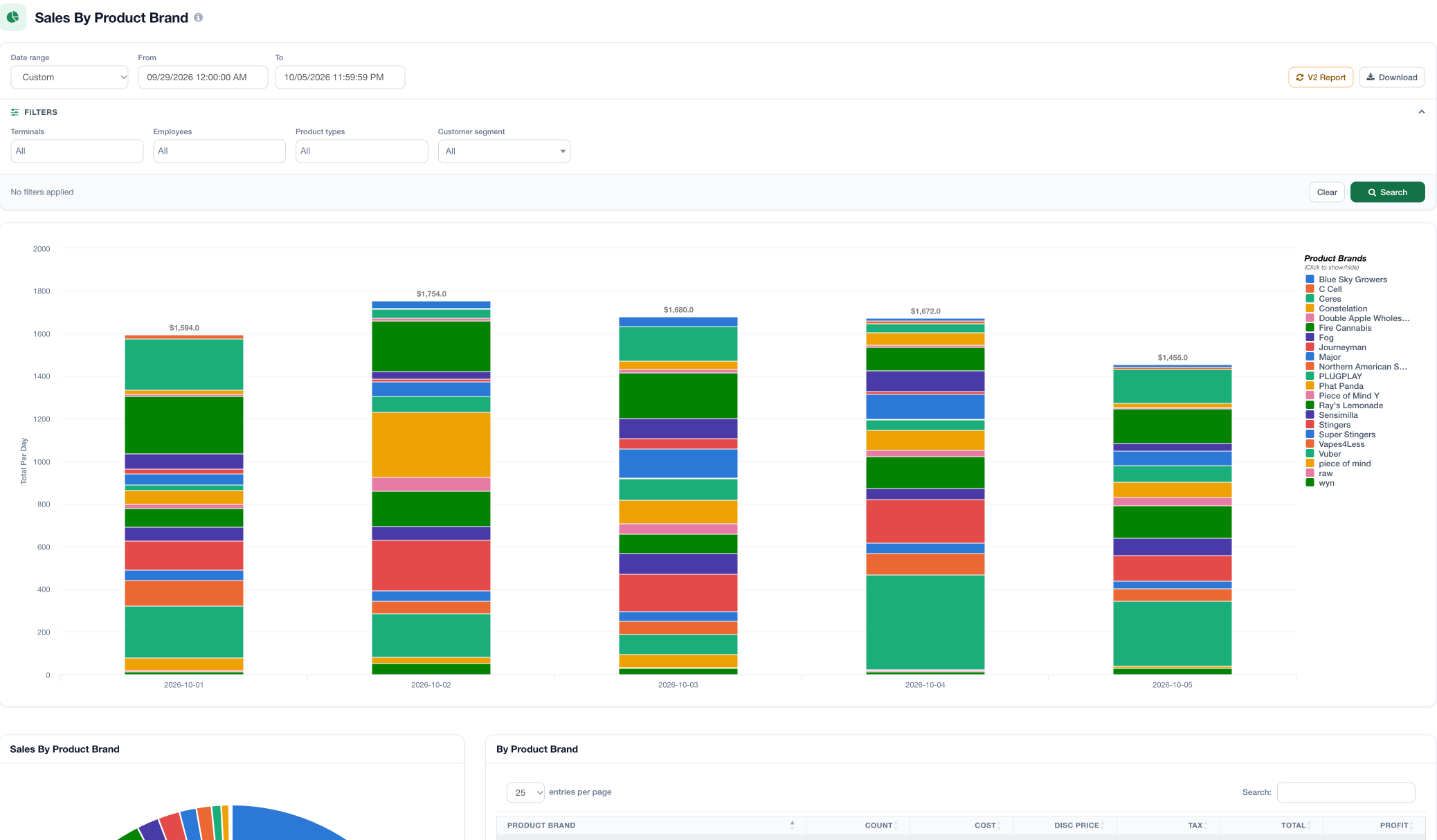
On the Legacy report page, you'll find a stacked bar graph showing sales by day, a pie chart and a condensed data table full of sales information, that is broken out by each brand. Using the legend to the right of the bar graph, click on a brand to show or hide it.
Use the entries per page dropdown above the table to show 10, 25, 50, or 100 brands at a time, or use the Search box to find a specific brand.
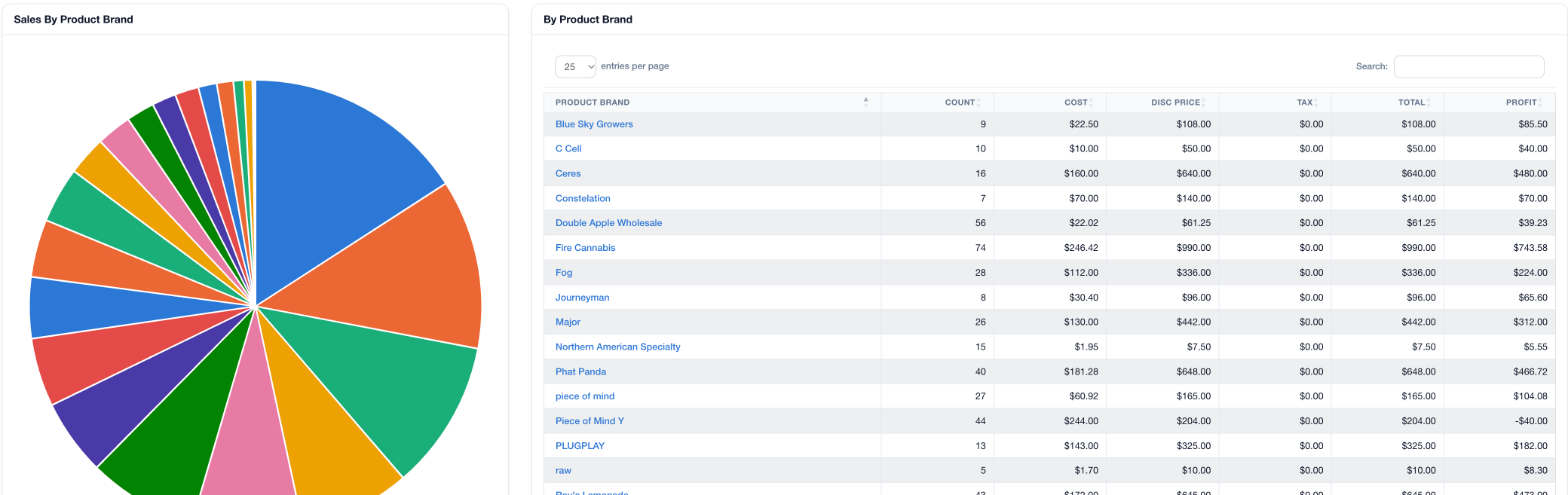
Click the Download button at the top of the page, to download the full report as an excel file.

For additional assistance please reach out to POSaBIT support @ 1 (855) POSaBIT OR SUPPORT@POSaBIT.COM