Sales Summary Report

The Sales Summary Report is a great way to monitor a general overview of your venue.
Sales Summary tracks total sales using a dynamic graph that is adjustable using filters to set a time frame, specific terminals, and employees. Depending on the time frame selected this graph will either be broken down by day or weekly sales totals.
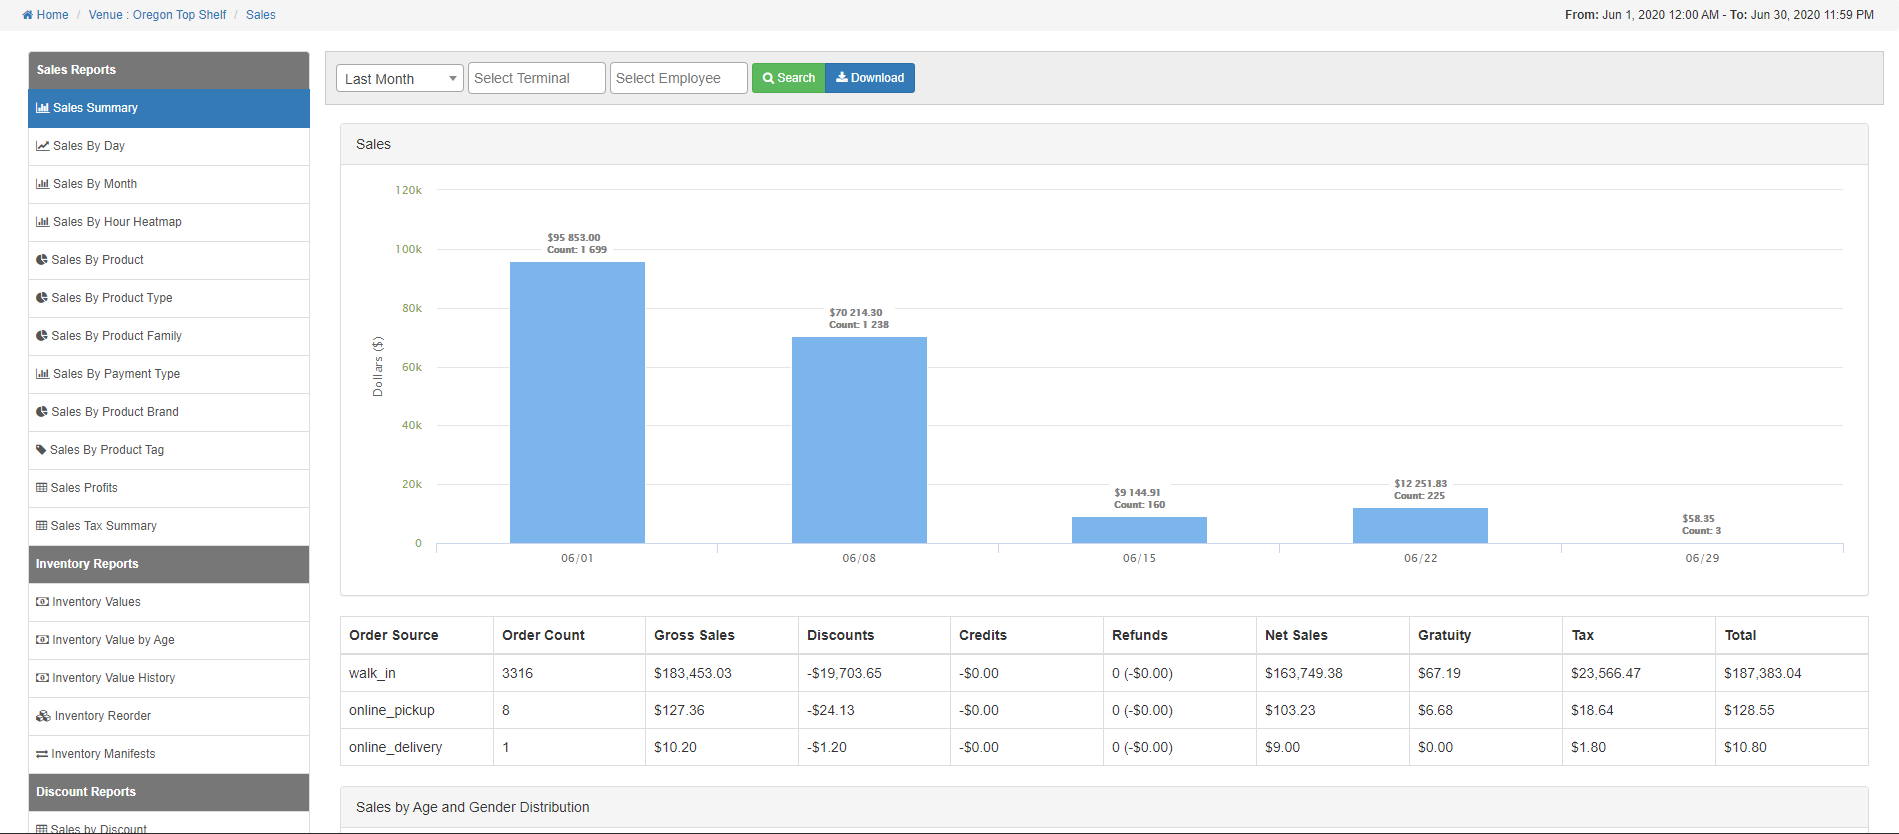
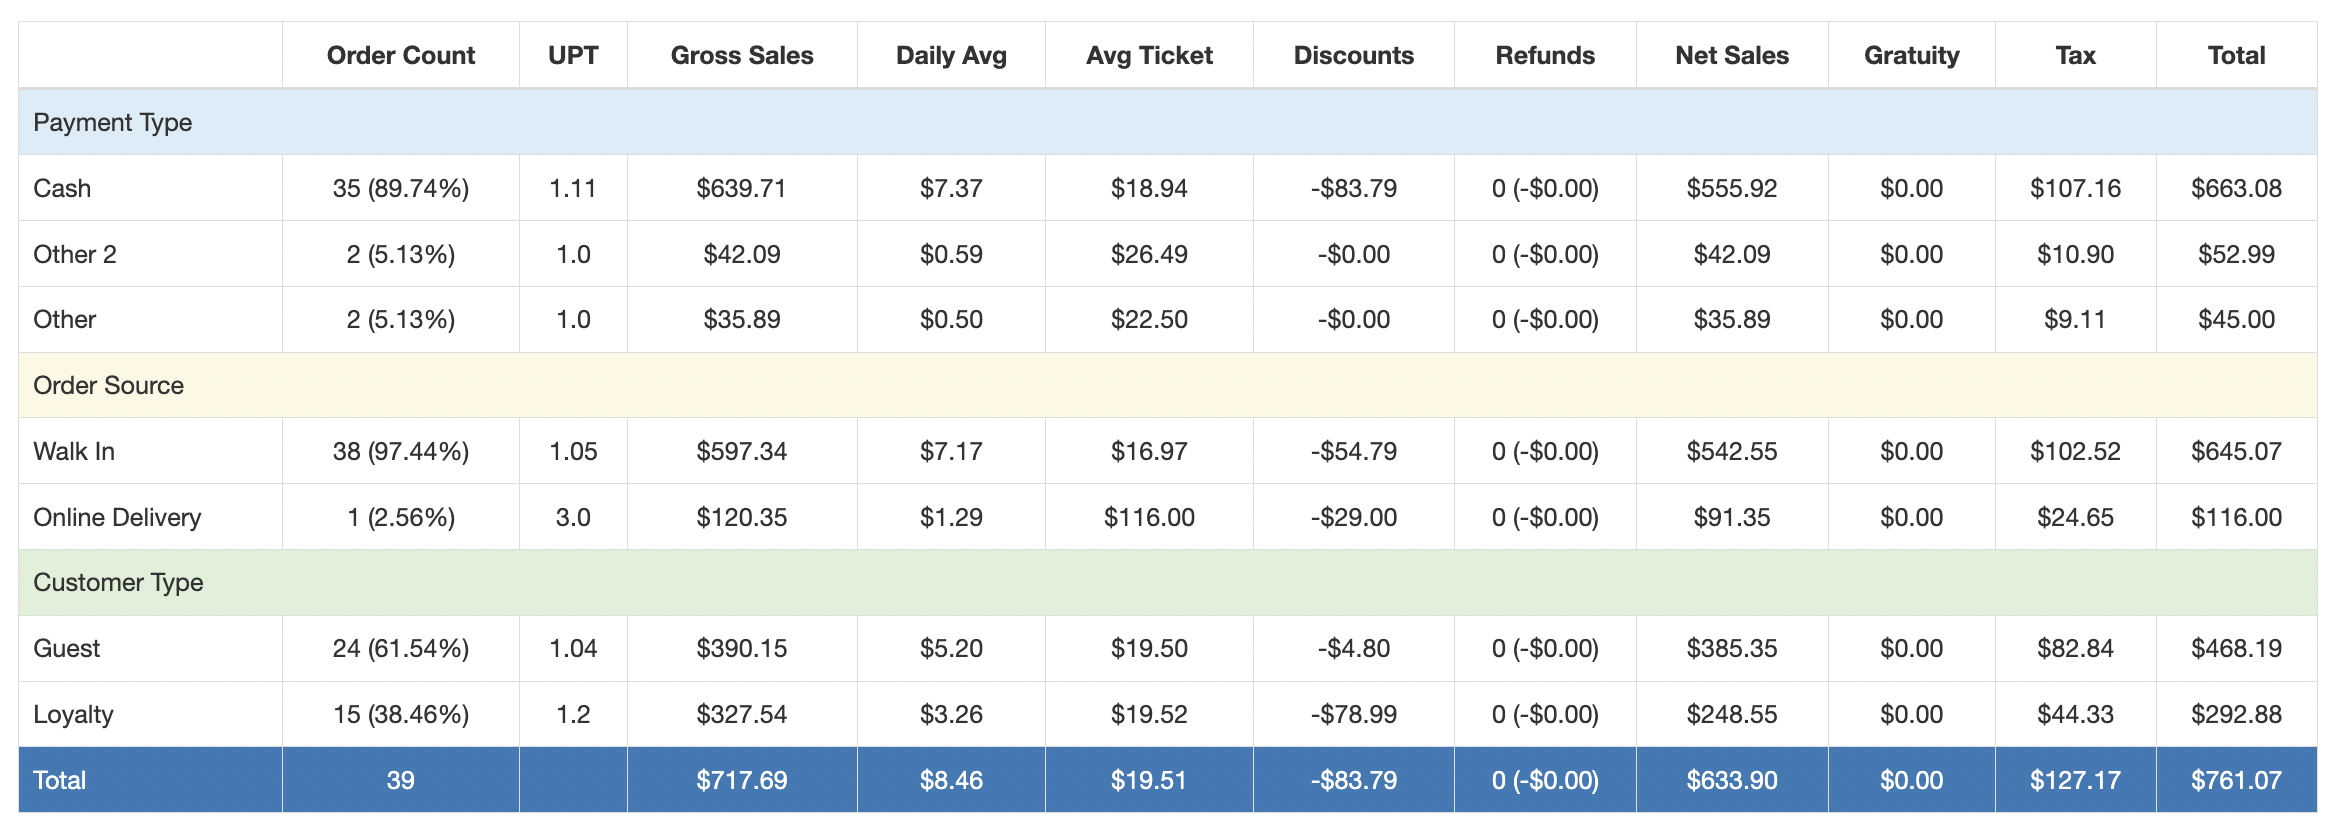
Additionally, this report includes a table that breaks down key sales metrics by order source. Metrics include sales data such as order count, gross sales, discounts, UTP (units per transaction), refunds, and more!
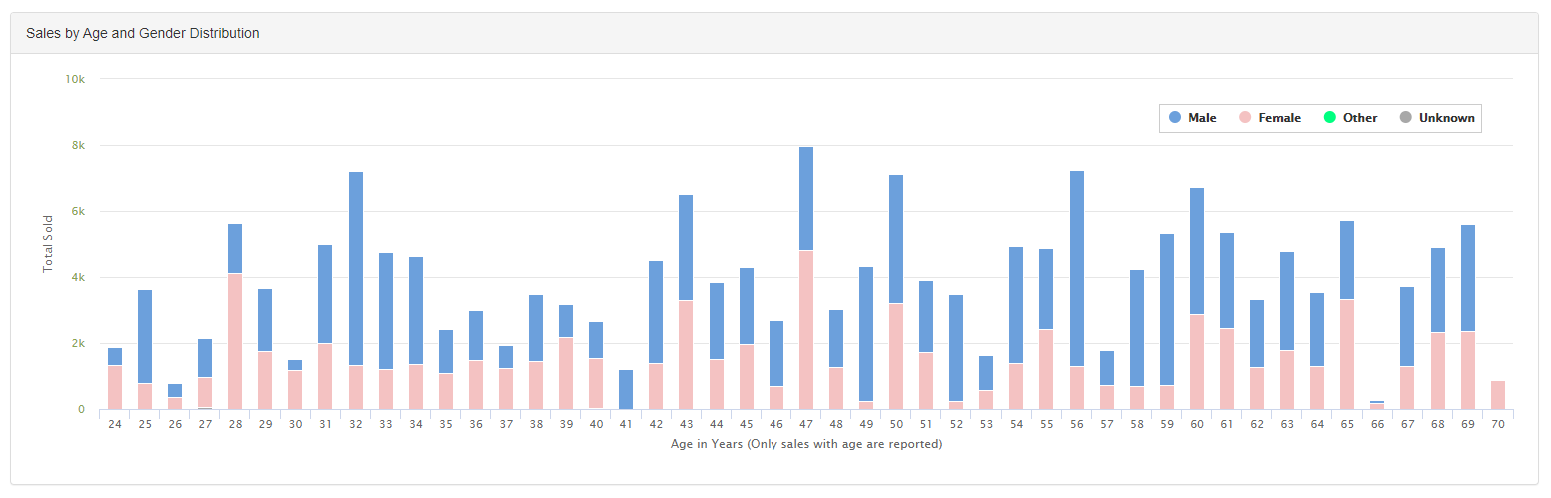
Lastly, at the base of the page is an age and gender breakdown of sales within the selected time frame. This stacked graph is a great way to identify your customer demographics.
For additional assistance, please reach out to POSaBIT support @ 1 (855) POSaBIT OR SUPPORT@POSaBIT.COM