Loyalty Dashboard Overview

The Loyalty Dashboard gives you a single view of how your POSaBIT loyalty program is performing. It shows how many points were given and redeemed, your outstanding points liability, new and returning loyalty customers, customer spend, how members compare with non-members, and which rewards customers can buy with points.
Note: The Loyalty Dashboard reports on POSaBIT Loyalty. If no loyalty program is set up for the venue, the dashboard shows a banner that says no points are being given, with a link to set up a loyalty program. See Loyalty: How to Turn POSaBIT Loyalty On and Loyalty: Setting Up your Loyalty Program.
Opening the Loyalty Dashboard
- Log in to the POSaBIT portal.
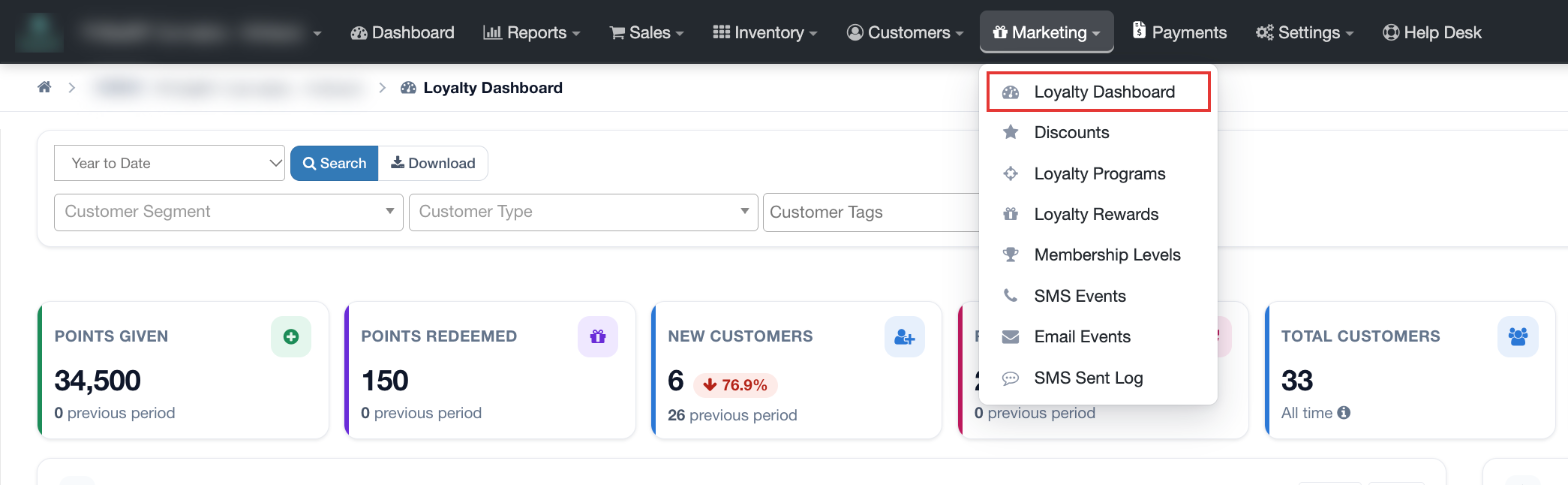
- Select Marketing in the top menu.
- Select Loyalty Dashboard.
Filtering the dashboard
Use the filter bar at the top of the page to choose what the dashboard shows, then click Search to refresh the results.
- Reporting period: choose a preset range such as Today, Last 30 days, Month to date or Year to Date, or choose Custom to pick your own dates. The selected range is shown at the top right of the page.
- Customer Segment: limit the results to one of your saved customer segments. See Customer Segments Overview.
- Customer Type: limit the results to Recreational or Medical customers.
- Customer Tags: select one or more customer tags to limit the results to customers with those tags. See Creating Customer Tags.
Click Download to download the dashboard data for the selected filters.
Summary cards
The row of cards below the filters summarizes the selected period. Most cards also show the value for a comparison period, with an arrow and percentage showing the change. For example, Today is compared with the same day last week, and Year to Date is compared with the same dates last year. The exact comparison dates are shown above the cards on the right.

Card | What it shows |
Points Given | Total loyalty points customers earned during the period. |
Points Redeemed | Total loyalty points customers spent on rewards during the period. |
New Customers | New loyalty customers during the period. |
Returning Customers | Loyalty customers who came back during the period. |
Total Customers | Every customer registered at the selected stores, all time. This number is not limited to the reporting period, but the customer filters still apply. |
Spend Total | Total customer spend during the period. |
Average Ticket | Average spend per visit during the period. |
Points Given & Redeemed, Points Liability, and New & Returning Customers
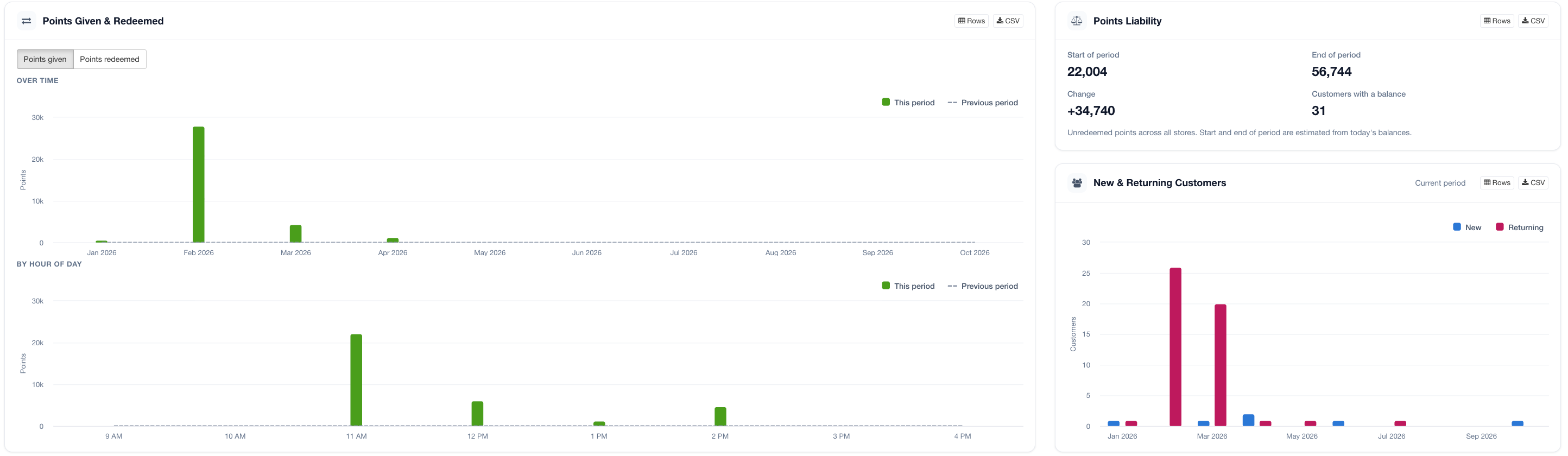
- Points Given & Redeemed: use the Points given and Points redeemed buttons to choose which measure to chart. The panel has two charts, each comparing this period (bars) with the previous period (dashed line):
- Over Time: points across the reporting period (for example, by month for Year to Date).
- By Hour of Day: when during the day points are given or redeemed, which helps you see your busiest loyalty hours.
- Points Liability: shows the unredeemed points balance at the start and end of the period, the change between them, and the number of customers who have a points balance. Points liability covers all stores, and the start and end of period are estimated from today's balances.
- New & Returning Customers: a chart of new and returning loyalty customers over the period.
Repeat Visits and Points-Redeemable Discounts

Repeat Visits compares loyalty members, non-members and all customers. Use it to see whether loyalty members visit more often or spend more than non-members.
Column | What it shows |
Customers | Number of customers in the group who visited during the period. |
Visits | Total visits by the group. |
Visits per Customer | Average number of visits per customer. |
Came Back (2+ Visits) | Percentage of customers who visited 2 or more times. |
Spend | Total spend by the group. |
Average Ticket | Average spend per visit. |
Points-Redeemable Discounts lists the rewards customers can currently buy with points, and how they were used during the period. The panel header shows how many discounts can be bought with points right now, and a Total row sums the redemptions, points and discount value.
Column | What it shows |
Reward | The name of the reward. |
Points Cost | How many points the reward costs. |
Redemptions | How many times the reward was redeemed during the period. |
Points at Current Cost | Redemptions multiplied by the reward's current points cost. |
Discount Value | The total dollar value of the discounts given through those redemptions. |
Click a column heading in either table to sort by that column. To create or change rewards, see Loyalty Rewards: Setting up Loyalty Rewards.
Customers By
The Customers By section breaks down the loyalty customers who were active in the period, comparing the current period with the previous one:
- Age Group
- Gender
- Customer Type
- Customer Tag: customers without a tag are shown as Untagged. A customer with several tags is counted under each tag.

Viewing and exporting the data
Panels have buttons in the top right corner:
- Rows: shows the numbers behind the chart in a table below it. Click Rows again to hide the table.
- CSV: downloads that panel's data as a CSV file.